frugi
1
- Messages
- 1,843
- Likes
- 133
No problem Mr Charts. I was interested in your trade and wanted to see it for myself, so posting the chart was a pleasure.
Now I'm afraid I have a question, which my mathematically inept mind is embarrassingly unable to answer.
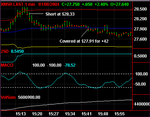
Here is a 10 min chart of ES overlaid with NQ.
Say I bought ES and sold NQ whenever NQ was >3 ES points above ES (as according to the overlay, not literally), with the view that within a few hours (days at most) they would meet up again and I could pocket a small profit. Whether or not this is a good idea is irrelevant: all I want to know is how many contracts of each I should buy or sell?
I originally thought that 2 ES v 5 NQ would do it but then realised the notional size of the positions would be different, although the $ per whole point would be the same.
I know there's a simple answer but can't quite seem to pluck it from the arid wasteland that is my brain!
Edit ... neurons starting to fire ...
Assume opening the trade at ES 1115, NQ 1485.
Buying 2 ES gives a position of £111500
Selling 5 NQ gives a position of -£148500
So I need my ES position to be 1.33184 times bigger to match them up.
This means I need 2.66363 contracts!
So I guess the closest reasonable approximation would be to go long ES 27 contracts and short NQ 50 contracts.
Eeek there must be a better way!
Attachments
Last edited:


