Best Thread My Journal at a Prop house

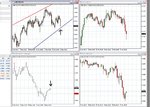
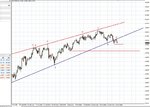
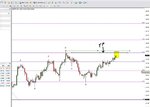
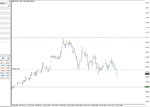
hi guys, and please dont give out to me:), i just want to post 2 charts on eur/usd this morning which please correct me if i am wrong are what pozzy has thought us
909.gif
my 1 hour lines marked

999.gif
target one = half the size of the stop, also my stop was moved down to swing high as price looke dlike it was truning

thanks
 
hi guys, and please dont give out to me:), i just want to post 2 charts on eur/usd this morning which please correct me if i am wrong are what pozzy has thought us
View attachment 79362
my 1 hour lines marked

View attachment 79366
target one = half the size of the stop, also my stop was moved down to swing high as price looke dlike it was truning

thanks

Looks like a nice trade porcel,

Not to sure how you found that range as my data looks a little different but you made a Logical plan by Identifying support and resistance and waiting to see how price reacts before making a decision and by the looks of things the result has been some pips in the bank. (y)


So you shorted the break of
 
i think i could have used the swing low of 13461 on monday, but i got a higher swing low yesteray of 14373 so i used that as my support line

is this completely wrong?

should i have kept with mondays support

swing hi is 13562


also i was wondering if you could post your charts of that trade if you had one?

with the levels you have n your charts

thanks this would be great help to me

and congrads again on the new job

thanks

pat
 
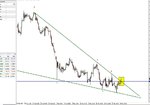
AudUsd reacting off the lower trendline that I ran through on the Vid and is making a higher high on the lower time frame,

attachment.php


so price bouncing of known support and making a higher high on the lower time suggesting the start of an uptrend waiting now for the pullback and it will be a valid long signal. :)
 

Attachments

  • AudUsd.jpg
    AudUsd.jpg
    161.8 KB · Views: 1,087
Entry for me on the AudUsd at 0.9135 stop is at 0.9100, little different in regards to profit targets with first target being at 0.9155 where I'll only take a 1/3rd off and only after this target is hit will stop management begin.

Trade is on and running. :)
 
Hi mate, AUDUSD is going to hit your stop soon.

Yeah mate, was stopped out (n)

Got in short at the break of the trendline at 0.9095 scaled out a 1/3rd at 9080, Got a feeling we might see a test of that previous support (blue trendline) and it act as resistance, but im trailing down my stop slowly so if we do then at least a small profit has been locked in. Still a loss for the day on the pair. :cry: but still have a position open.
 
Thanks for all the msgs and comments, :)

Due to the busy week not really had the time to post as been all over the place,

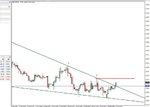
AudUsd is the love of my life at the moment (even though got caught on the long trade) but I just think it's a really nice looking chart. Price bounced off the blue support trend line and put me long however the trade was stopped out. Price then broke through the support line and sold of getting me in short and cashing out on a very small profit. As I mentioned in my previous post I was expecting a retest of the support line and to see it act as resistance as we have seen happen several times with this pair and that is exactly what happened today. So the result was a nice short trade and I've marked off where i think next levels of support could be.

attachment.php


Hopefully next week I will be more on the ball with my post once im a little settled

Thanks again for all the support :)

Pozzy
 

Attachments

  • AudUsd.jpg
    AudUsd.jpg
    149.6 KB · Views: 1,157
just a quick question pozzy

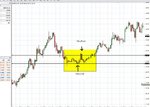
i was wondering if you could check this and tell me if i am marking the the 1 hour overnight range correctly and are my lines in the right place for the brakeout trade

thanks999.gif
 
just a quick question pozzy

i was wondering if you could check this and tell me if i am marking the the 1 hour overnight range correctly and are my lines in the right place for the brakeout trade

thanksView attachment 79642


Hello mate,

Not really to sure mate.

You have marked off a previous swing high and low and drawn your lines from there nothing wrong with this but it dosn't mean that the market is range bound. In this case the range is the part I have highlighted.

attachment.php


Try looking at a 15min chart that way you will be able see price contained within those levels over a few bars. I have marked it out on a 15Min chart.

attachment.php


You can see the range over the Asian session, there was a few false breaks none of which would have been enough to get an entry on the lower time frame. Untill eventually the range broke to the upside and you would of been put in long and by the looks of things would of been a nice trade. (y)

Hope that helps

Pozzy:D
 

Attachments

  • 79642d1269620380-my-journal-prop-house-999.gif
    79642d1269620380-my-journal-prop-house-999.gif
    53.2 KB · Views: 1,120
  • EJ.jpg
    EJ.jpg
    142.7 KB · Views: 1,103
Aud/Usd came 5 ticks away from my target. If it doesn't get down there by 6 then Ill close out due to it being a Friday. Been a nice trade though and has locked in a min of 100 ticks and thats on 2/3rds of the position due to the different trade management as this has been a swing trade. Been focusing on this trade all week, got stung first off with the long, made a tiny tiny profit with the short off the break of support and finally the money maker has been on price testing that blue trend-line again and seeing it act as resistance this time so it has finally paid. :)

Have a good weekend and hopefully Im back on the track from next week.
 
thanks for the reply mate,
i think am even more confused now sorry

should i just be lookin for area were the market is in a tight range say on the 1 hour chart then draw the lines for this range?

just lookin back at some of your posts there is 60min charts with some big ranges that so not sure you were lookinf for a congestion area there

sorry again just seem to be drawing my lines in the wrong areas

just addeing another example from yseterday please let me know if you could if i have identified the correct area

cheers
have a great weekend
pat999.gif
 
Hi guys,

Quick vid for next week looking at the GbpJpy and GbpChf.

Thanks for all the posts and comments (sorry if I haven't replied yet but I will)


Thanks

Pozzy
 
Good morning,

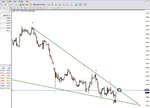
GbpChf actually gapped down to that lower support level and bounced. So this support trend line seems to be a fairly interesting level. I am going to trade these diagonal trend lines in the same way I would on a horizontal range. That is to look for price to breakout at either side or to turn around at each extreme. I still would really like to see things come together at Fridays high and that upper trend line but either way I feel that there is still some life in this setup even if I have seen it a little late on in the pattern.

attachment.php


The GbpJpy played out fantastically except for the one problem of me being lazy and not out of bed quick enough to catch it (still not started new job). Entry would of been at 138.35 and scale out achieved if you were taking out the 2/3rds at half stop size or it has hit that profit target I was looking at in the vid being at the 61.8% retracement level.

However there is still value in this, as price is now at a known point of resistance not only at the 61.8% level but also at a previous swing high which is the highest point of the overall retracement. I have missed the long setup but if price turns around here then I have the green light to look for shorts. The 4hr bar is looking like it might form a hammer so a good indication that price is going to reverse. So waiting for price to turn around on my lower time frame or for this 4hr reversal bar to complete.

attachment.php
 

Attachments

  • GbpChf.jpg
    GbpChf.jpg
    74.1 KB · Views: 1,065
  • gbpJpy.jpg
    gbpJpy.jpg
    75.7 KB · Views: 1,059
Took the GbpJpy short at 138.50 first target is 138.15

attachment.php


Come on gbp (y)
 

Attachments

  • GJ.jpg
    GJ.jpg
    61.7 KB · Views: 1,043
GbpJpy trade dull to say the least as it is still flirting with the entry level, going to be an overnighter. :sleep:
 
Morning,

gbpJpy got down to first target over night and scale out was achieved. When I sat down at the desk price was making higher highs and higher lows so I managed my stop to the previous swing high at 138.70. the trade was then stopped out for an overall profit of +15. Not the most exciting trade but better than a poke in the eye. :)

GBPCHF came together very nicely and broke long bang on where Fridays high met that upper trend Line (see above post).

attachment.php


Long at 1.5965 sl a tight stop below the pull back at 1.5950 and price very quickly hitting the scale out. (y)
 

Attachments

  • GC.jpg
    GC.jpg
    66.3 KB · Views: 1,014
GbpChf having a go at making new highs, If we get through this 00 then Next possible level of resistance around the 1.6050 level.

attachment.php


Come on GbpChf!!
 

Attachments

  • Res GbpC.jpg
    Res GbpC.jpg
    65.5 KB · Views: 961
GbpChf stop managed to 5990 the trade +16 on the first portion and now + 25 on the last 3rd so worst case scenario is +41 on the overall position. still got my eye on 1.6050 though. (y)
 
GbpChf really going for it and smashing through target level. stop managed to 1.6055 so worst case the trade is +106 ticks :)
 
Top