You are using an out of date browser. It may not display this or other websites correctly.
You should upgrade or use an alternative browser.
You should upgrade or use an alternative browser.
SvenFoster
Well-known member
- Messages
- 250
- Likes
- 10
Pozzy, do you find now that you arent constrained by the prop-shop that your happier in your trading? I mean specifically your ability to trade additional pairs.
Pozzy, do you find now that you arent constrained by the prop-shop that your happier in your trading? I mean specifically your ability to trade additional pairs.
Hi Sven,
Thanks for the comments.
I was only at the prop firm for about 3 1/2 months so hard to say really. It was a good opportunity to gain some backing and a good experience all of which helped me to get this current position. Much happier being out of there though and have soo much more freedom where I am working now. I am not capped at silly risk limits and I can hold positions overnight. I also can gain access to the account from home as well as being able to trade any pair and even other financial instruments, all things that I was unable to do at a prop shop. So all in all much happier.
Thanks again
Pozzy 🙂
Is anyone else suffering withdrawal symptoms here? pozzy, I need your words of wisdom!
Haha 🙂
Sorry guys,
Been really really busy as started at the new company this week and i'm just trying to find my feet with the new systems and stuff like that. I should be trading again from next week so will be back to making regular posts then and it should be all systems go.
Hows everyone been doing? Making money I hope!
Thanks
Pozzy 😀
🙂Ok so just to follow up as I didn't want to let the team down, I had a quick glance through the charts.
EurUsd caught my eye with very very brief idea and one that I am not trading as I haven't really looked at it properly. As I am sure you have noticed most of my trade setups are identifying an area of interest (support or resistance) and then simply seeing how price is reacting to that level. Looking on the 4hr we can see that EurUsd sold off found support and then retraced just shy of a 61.8 Fib. It has now sold off again and is reproaching that support level which I have marked off.

So we are going to either going to see a price turn around at this level which you could gage by a 4Hr reversal bar if you were being very conservative or by watching how price action reacts, I would use the 15min chart in this case not the usual 3min. Or the other scenario is that we see a break of this level so a break out pullback setup would be valid as price will be pointing down on the 4hr and 1hr as well as be making a new low for the day. Its not a trade that I will be taking and not my greatest post but hope there is some info in there somewhere that is helpful 🙂
EurUsd caught my eye with very very brief idea and one that I am not trading as I haven't really looked at it properly. As I am sure you have noticed most of my trade setups are identifying an area of interest (support or resistance) and then simply seeing how price is reacting to that level. Looking on the 4hr we can see that EurUsd sold off found support and then retraced just shy of a 61.8 Fib. It has now sold off again and is reproaching that support level which I have marked off.
So we are going to either going to see a price turn around at this level which you could gage by a 4Hr reversal bar if you were being very conservative or by watching how price action reacts, I would use the 15min chart in this case not the usual 3min. Or the other scenario is that we see a break of this level so a break out pullback setup would be valid as price will be pointing down on the 4hr and 1hr as well as be making a new low for the day. Its not a trade that I will be taking and not my greatest post but hope there is some info in there somewhere that is helpful 🙂
Attachments
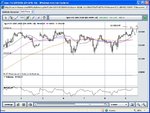
Alright PozzyP mate. You know last night we were talking about cable. It broke out the range from previous high on 5th April of 1.5320, so useless i would have stop to buy at 1.5325-27, it got up to 34 so obviously i wouldnt have closed it out, so now i would put my stop above the false break out at 40, and now its currently trading 72 and wouldnt even have gone a pip against me. Also I have a screenshot of a reversal of GBPUSD at 1.5280 on 7th April, so i'm looking for the swing high to be equal or lower than the previous swing high, trading at the close of the proceeding 10min bar, which in this case is at 1.5262 and yet again i could use a stop 1 tick wider than the spread and i wouldnt get stopped out. I like your style.
Attachments
Last edited:
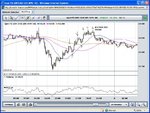
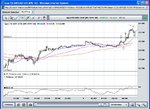
So here i'm looking for this to be a double top and the swing high to be at the same level as the previous swing high. At the close of the proceeding bar, i will short GBPUSD. I've drawn in one bar just to show my thinking. If it carries on going up then i'll scrap it altogether.
It carried on going up, so i scrapped the idea. It's not always a good idea to bet against the trend, but at least this way you dont get hurt because you dont jump in when you know 80 is a level. Normally i would be looking to go long and use the false breakout method as before but it has already moved 120 ticks up today, which is over 50% of the average daily move, meaning theres probably not much left in the trade to the upside. Anyway i better stop before i reveal all of Pozzy's secrets. That's the best training i'll get for a grand.
It carried on going up, so i scrapped the idea. It's not always a good idea to bet against the trend, but at least this way you dont get hurt because you dont jump in when you know 80 is a level. Normally i would be looking to go long and use the false breakout method as before but it has already moved 120 ticks up today, which is over 50% of the average daily move, meaning theres probably not much left in the trade to the upside. Anyway i better stop before i reveal all of Pozzy's secrets. That's the best training i'll get for a grand.
Attachments
Last edited:
Haha Alright Brett,
Trades looking good mate, That failed high is a great way to trade a reversal it has a million different names but essentially its all the same thing. ABC/123 pattern, a double top, a head and shoulders all those things.
Brett is a mate of mine who is a trader in the Wharf and we bounce a lot of ideas about so hopefully he can post some on here to.
Thanks for the input mate.
pozzy
So here i'm looking for this to be a double top and the swing high to be at the same level as the previous swing high. At the close of the proceeding bar, i will short GBPUSD. I've drawn in one bar just to show my thinking. If it carries on going up then i'll scrap it altogether.
It carried on going up, so i scrapped the idea. It's not always a good idea to bet against the trend, but at least this way you dont get hurt because you dont jump in when you know 80 is a level. Normally i would be looking to go long and use the false breakout method as before but it has already moved 120 ticks up today, which is over 50% of the average daily move, meaning theres probably not much left in the trade to the upside. Anyway i better stop before i reveal all of Pozzy's secrets. That's the best training i'll get for a grand.
looking at a possible setup on the Gbpjpy, Things looking rather bullish on the 4hr
I have fibbed from the low of the move to the high on the 4hr chart and we can see that there was a 38.2 retracement and price looks like it's having another go at making a new high. What I am really looking for is where this High forms if price fails and makes a lower high here then I feel that there is fair grounds to be looking for shorts on the back of a further retracement. If price pushes up and breaks to a new high then we have had a 38.2 retracement and things are looking bullish as price makes higher highs and higher lows. I don't think that this will play out today but maybe early into next week.

Looking at things with an intraday view on the 15Min its def been a bullish day and we are in an uptrend with price making higher highs and higher lows. we have now seen a bit on a consolidation and price looking like its run out of steam so taken a Fib from the low of the day to the high and Im looking for a retracement to give me the possibility of buying.

Thanks
Pozzy
I have fibbed from the low of the move to the high on the 4hr chart and we can see that there was a 38.2 retracement and price looks like it's having another go at making a new high. What I am really looking for is where this High forms if price fails and makes a lower high here then I feel that there is fair grounds to be looking for shorts on the back of a further retracement. If price pushes up and breaks to a new high then we have had a 38.2 retracement and things are looking bullish as price makes higher highs and higher lows. I don't think that this will play out today but maybe early into next week.
Looking at things with an intraday view on the 15Min its def been a bullish day and we are in an uptrend with price making higher highs and higher lows. we have now seen a bit on a consolidation and price looking like its run out of steam so taken a Fib from the low of the day to the high and Im looking for a retracement to give me the possibility of buying.
Thanks
Pozzy
Attachments
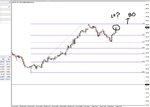
Morning mate. I have a little chart for you today. Too early for confirmation, but it seems as if eurusd has bounced of 50% retracement of the movement from last night to today. I was wondering if you were looking at it and could give your input on the move.
EDIT: I dont know if anyone noticed but i had the retracement upside down. Makes no difference but apologies neverless. So using the idea of a 15min bar close above the 38.2%(61.8% in this case) giving me the reversal. I went long 600k at 1.36204 with a stop at 1.35954. First target for 400k was met at 1.36334, leaving the last 200k as a risk free trade. Although EURUSD looking heavy here, but i'll stick to my guns.
Stopped out, so no luck this time.
Brett
Attachments
Last edited:
I dunno mate,
Not really to sure how you have drawn that fib. I usually like to take it from the low to the high you have kind of drawn it from a high to a high Plus I dont like the fact that there is such a big gap.
Not really to sure how you have drawn that fib. I usually like to take it from the low to the high you have kind of drawn it from a high to a high Plus I dont like the fact that there is such a big gap.
Morning mate. I have a little chart for you today. Too early for confirmation, but it seems as if eurusd has bounced of 50% retracement of the movement from last night to today. I was wondering if you were looking at it and could give your input on the move.
Brett
EurJpy in a 15 min trading range, marked off the days high and low and simply looking for a break to either side.

So nothing to complex, just going on the very simple theory that price has to move at some point as it cant stay range bound for ever so will wait and see what way it breaks and then work out targets and other levels from there.
So nothing to complex, just going on the very simple theory that price has to move at some point as it cant stay range bound for ever so will wait and see what way it breaks and then work out targets and other levels from there.
Attachments
EJ still bouncing around in its range so no change there. Cable sold off and So i have taken a fib of the move and just going to wait and see if we some form of retracement. Looking for at least a 50% fib (it came close but just fell a little shy) the 38.2 doesn't have enough meat on the bone.

Back to waiting
pozzy
Back to waiting
pozzy
Attachments
EJ breaking to a new Low and out of its range, giving me the short signal, however price instantly pulled all the way back and broke its previous swing high. Because of this price to me is saying that it is still not ready to go down. So until I see price making Lower lows lower Highs then the short is off the table and the range stands. Im about to call it a day so cant really see myself trading this one. 👎
Morning Mate. Got a trading idea for you and for anyone whos willing to have a look. I've drawn a few trend lines for USDCAD and i have noticed this descending wedge formation with decent support showing on the bottom trend line, usually with these descending wedges, price action breaks the trend line with the highest gradient, in this case i am suggesting the upside.
This is a daily chart and may not develop for a while, but i have plotted the moves in the market and i have noticed that the market falls around this time after every quarter. So my medium term view for USDCAD is long and strong. I know there are some sellers today of dollars, which may try and skew my opinion.
EDIT: Also just to throw it out there. DOW JONES 61.8% retracement is around 11250 from the 14k+ - 6.5k move, so are we building up for a big drop??? Maybe a bit too pessimistic but you never know... Dont mention to Elliot the third wave is forming!!
Attachments
Last edited:
EJ breakout looks like it would of paid I personally wasn't on it. Anyone catch a piece??
EurUsd providing a setup with Price range bound, I'm taking the range using a 4hr chart. We can clearly see several inside bars having formed and that is what I am using to get my range.

There has been a little false break which we are able to see more clearly on the 15Min so I will manage my resistance level to the breakout high.

So back to waiting...
EurUsd providing a setup with Price range bound, I'm taking the range using a 4hr chart. We can clearly see several inside bars having formed and that is what I am using to get my range.
There has been a little false break which we are able to see more clearly on the 15Min so I will manage my resistance level to the breakout high.
So back to waiting...
Attachments
Similar threads
- Replies
- 4
- Views
- 3K
- Replies
- 12
- Views
- 8K
- Replies
- 6
- Views
- 4K


