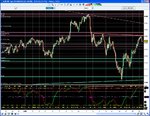
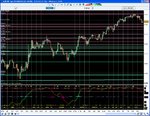
Most Indicators are useless - why does anyone bother with them?

No kidding. I've got a guy with 20+ years market experience sitting not 10 feet from me in the office saying we've put the bottom in. I've got another colleague who said on a call this morning that so long as the S&P stays above 1274 he's bullish. Me, I'll just trade the way the market tells me to.

LOL! Remind him of that when we put the next 'bottom' in. Pumping a puntured tyres dont work! For long anyways! :whistling
 
Last edited:
Interesting thread so far. Similar to another poster, I use repeatbale patterns of certain indicators at identifiable areas of potential support/resistance to enter the market (both with and against trend.) The purpose of the repeatable indicator patterns is in provbiding further technical confluence at such a potential supp/res area (they are all potential supp/res areas when price visits them in realtime) in order to enter the market with a high degree of probability when confirmed too by individual price action itself.

Using a very simplistic example if for example you had identified a resistance level at 0000 and price had arrived there at the same time that say stochastics were in extreme overbought territory, you would probably have more confidence in entering the market than without this knowledge, even if just for a small retrace/pullback trade.

My point is that indicators on their own are probably as useless as some on this thread and other places suggest, but when used as part of an overall tactical approach to your chosen market that may include support/resistance and price action itself, then they have value and can assist in pinpointing the optimum market entry, thereby potentially reducing stop size arequired with the potential effeciency benefits this has.
 
An more detailed less simplistic actual example to the above post, Gbpusd today... price broke through the 9645/55 resistance area (decsribed as holding offers by MNI) and on a re-test pullback to this Resistance area now potentially acting as Support (SBR,) one of my band/channel deviation, hidden divergence based indicator patterns presented itself., confirmed then by individual price action itself.

The confluence of supp/res, indicator pattern and price action itself provided the confidence to enter the market with trend at that level.

1min trigger Re-entry type 1
 

Attachments

  • 1min [trigger] Re-entry type 1.gif
    1min [trigger] Re-entry type 1.gif
    20.3 KB · Views: 250
Qed

Found this on another forum.

Is it the indicators that are useless or the indicatee???
 

Attachments

  • AAARGH.gif
    AAARGH.gif
    34.9 KB · Views: 265
Interesting thread so far. Similar to another poster, I use repeatbale patterns of certain indicators at identifiable areas of potential support/resistance to enter the market (both with and against trend.) The purpose of the repeatable indicator patterns is in provbiding further technical confluence at such a potential supp/res area (they are all potential supp/res areas when price visits them in realtime) in order to enter the market with a high degree of probability when confirmed too by individual price action itself.

Using a very simplistic example if for example you had identified a resistance level at 0000 and price had arrived there at the same time that say stochastics were in extreme overbought territory, you would probably have more confidence in entering the market than without this knowledge, even if just for a small retrace/pullback trade.

My point is that indicators on their own are probably as useless as some on this thread and other places suggest, but when used as part of an overall tactical approach to your chosen market that may include support/resistance and price action itself, then they have value and can assist in pinpointing the optimum market entry, thereby potentially reducing stop size arequired with the potential effeciency benefits this has.

Does the stochastic indicator add anything to the fact that your level is a resistance zone? I bet it doesn't. The only explanation I can buy is the one that says lots of people watch some indicator and it therefore becomes self-fulfilling. Apart from that, indicators are such an obvious waste of time. What in an indicator makes it tell us anything about price? Nothing, when you think about it.
 
An more detailed less simplistic actual example to the above post, Gbpusd today... price broke through the 9645/55 resistance area (decsribed as holding offers by MNI) and on a re-test pullback to this Resistance area now potentially acting as Support (SBR,) one of my band/channel deviation, hidden divergence based indicator patterns presented itself., confirmed then by individual price action itself.

The confluence of supp/res, indicator pattern and price action itself provided the confidence to enter the market with trend at that level.

1min trigger Re-entry type 1

I don't have an indicator that draws ovals at turning points. Wish I did though, looks like the best indicator of them all.
 
Using a very simplistic example if for example you had identified a resistance level at 0000 and price had arrived there at the same time that say stochastics were in extreme overbought territory, you would probably have more confidence in entering the market than without this knowledge, even if just for a small retrace/pullback trade.

It sounds like RSI is telling you what you already know. The implication is a lack of faith in one's ability to identify S/R. RSI, after all, tells you nothing more than you can read on the chart.
 
Indicators are like training wheels on a bicycle. Those who eventually learn how to ride the bicycle without them will never reinstall them. But those who leave them on the bicycle will still make it from Point A to Point B.

Indicators are therefore not "useless" and they do "work", at least for those who need them. But those who don't need them may wonder why anyone would bother.

(Lance Armstrong did not use training wheels :))
 
Last edited:
Interesting thread so far. Similar to another poster, I use repeatbale patterns of certain indicators at identifiable areas of potential support/resistance to enter the market (both with and against trend.) The purpose of the repeatable indicator patterns is in provbiding further technical confluence at such a potential supp/res area (they are all potential supp/res areas when price visits them in realtime) in order to enter the market with a high degree of probability when confirmed too by individual price action itself.

Using a very simplistic example if for example you had identified a resistance level at 0000 and price had arrived there at the same time that say stochastics were in extreme overbought territory, you would probably have more confidence in entering the market than without this knowledge, even if just for a small retrace/pullback trade.

My point is that indicators on their own are probably as useless as some on this thread and other places suggest, but when used as part of an overall tactical approach to your chosen market that may include support/resistance and price action itself, then they have value and can assist in pinpointing the optimum market entry, thereby potentially reducing stop size arequired with the potential effeciency benefits this has.

Im not taking the mickey here, it was the case for me! I think this the main reason for indicator use/abuse! Lack of confidence! People need confirmation / proof!!! By the time it all lines up the meat of the trade has usually been missed! Ive grudgingly come to the conclusion that confirmation costs! imho
 
Last edited:
Indicators
On one level, everyone uses them. Even those who use price only patterns or price and volume patterns are using ‘calculated’ indicators – calculated of course with a much wetter and grayer neural net math but nonetheless calculated via wetware and output to the mouse clicking lobes. Same for trendlines – of any angle (including 0 deg). :-0 Mathematically placed there by the wetware, they serve as (reassuring) indicators even to those who eschew indicators. Any pattern a trader is drawn to (whether applied or not) is actually just an indicator. Get real. No longer using coded indicators doesn’t in the least free one from indicators. The computational distinction can be maintained but that is basically just splitting hairs. Resisting indicators is futile... embrace them, all of them - but only use the ones that resonate from within. "My dear Watson, there we come into those realms of conjecture where the most logical mind may be at fault." Sherlock Holmes
 
I design my indicators so I can know what is happening on multiple time frames in a glance. Simple things like higher/lower highs/lows, whether the price is above/below the previous close or midpoint, etc...

It is so much quicker than flipping through a bunch of charts. Not to mention if you forget to read one of your chart indicators, it could cost you big time! That's what caused me to invent my TREND INDICATOR for TradeStation RadarScreen.
 
Indicators are like training wheels on a bicycle. Those who eventually learn how to ride the bicycle without them will never reinstall them. But those who leave them on the bicycle will still make it from Point A to Point B.

Indicators are therefore not "useless" and they do "work", at least for those who need them. But those who don't need them may wonder why anyone would bother.

(Lance Armstrong did not use training wheels :))

I think weather and climate is a better analogy.
 
fwiw there is a guy in the USA who at a live seminar traded using just CCI with price bars blanked out. During the whole trading day, using a 3 minute chart I believe he made 24 trades all of which were winners.
 
fwiw there is a guy in the USA who at a live seminar traded using just CCI with price bars blanked out. During the whole trading day, using a 3 minute chart I believe he made 24 trades all of which were winners.

i wonder what his drawdowns were like!
 
the screenshot below shows the cci hook technique (bottom oscillator) on the 5min chart in this morning's gbpusd price action. I use it in conjunction with my other oscillators, looking for the hook from extreme when they reach extreme readings at support/resistance. The resistance in question was the Dly/4hr descending trend line in the area of Dly R1 pivot and the 123.6% extension of yesterdays up move shown in the 2nd screenshot. Mni had confirmed offers in the 9845/55 region.

(incidentally the cci hook was present too on the 15min chart at that level, and on the 1min [my trigger] I had one of the repeatable Reversal set-ups I look for that involved oscillaor divergence. This combined with the oscillator extremes and the band/channel deviation to the 15min chart pinpointed a reversal in underlying immediate price action trend at that Resistance.)

Just an example of a cci technique and an offer of more evidence that indicators used in the right context as part of a confluence of reasons, help in making trading decisions/pinpointing entries, particularly on the shorter time frames where price action can be noisy.
 

Attachments

  • 5min.gif
    5min.gif
    16 KB · Views: 224
  • 4hr.gif
    4hr.gif
    20.8 KB · Views: 234
Last edited:
AUD/USD
Using SMI
Divergence and Extreme Readings at a clearly identifiable SBR zone.
 

Attachments

  • AUDUSD 2hr 250108.JPG
    AUDUSD 2hr 250108.JPG
    255.1 KB · Views: 203
  • AUDUSD 30min 250108.JPG
    AUDUSD 30min 250108.JPG
    268.6 KB · Views: 174
I actually find that price gets in the way of my indicators...price is nothing more than something that happens whilst I'm busy watching my indicators!! (hehehe...:LOL:)
 
In fact, I'm through with price, we are going our seperate way...see chart below:
 

Attachments

  • f.gif
    f.gif
    11 KB · Views: 217
Top