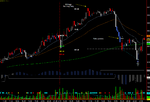
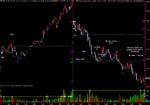
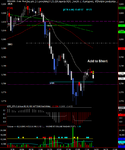
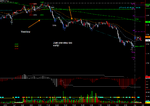
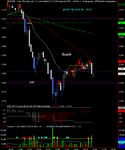
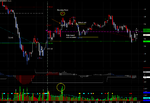
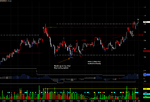
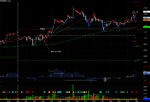
Mechanical Trading Intra Day

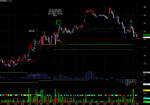
Long near the Highs of the Day

May 7th

Ym (200)
EMD (550)
ER2 (250)
DAX 413
ESTX 140
SMI 40

Net (408 )/ (1,223)


Poor day yesterday.
Morning looked good with the European markets - all very nicely in profits until 1530 (UK time) and then everything tanked down sharply.


We managed to exit with some healthy profits on the European side but the USA managed to get us in long very near the Highs of the Day so we suffered considerably.
 

Attachments

  • er2 may 7.png
    er2 may 7.png
    31.5 KB · Views: 192
Double Top Pattern

May 8th

Ym -215
EMD -200
ER2 -520
DAX +25
EST + 5
SMI -90

Net -995 / -2,985


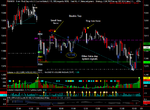
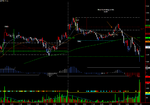
Great example of a Double top pattern.
Very reliable pattern and I really wanted to short this - but this blog is not about that so we exited gracefully to save us from a maximum loss on SMI.
 

Attachments

  • may 8 smi 2B.png
    may 8 smi 2B.png
    44.7 KB · Views: 195
What do YOU think?

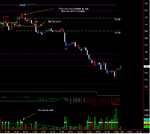
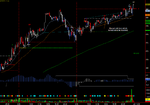
Interesting one today. Got in long on the USA indices and it shot off like a bat out of hell. Parabolic rise and big wide bars.
Did I make the right decision getting out here? Don't cheat - just look at the evidence - bottom graph is volume , middle graph is also volume, (different layout) top study is an oscillator.
Magenta lines on the main price graph are Pivot lines - the 61% and 50% lines are cued from yesterday's range.

Make your mind up and then read the next post.
Ps when I did this I had just exited 2 of our 3 contracts. The last one we leave to see if the trend resumes.
 

Attachments

  • may 9 er2 exit 1.png
    may 9 er2 exit 1.png
    29.8 KB · Views: 186
Outcome

this was a much further pullback than I imagined.
 

Attachments

  • may 9 v 2.png
    may 9 v 2.png
    32.6 KB · Views: 188
May 17th Weeks Performance

Net gain 995 / 2,985 (pos sized)

Friday was a bit of a pain in that we lost 3,465 position sized but as I spent most of the week away these were just the basic rules. More aggravating in that on Thursday we hit a new equity high.
Most of the losses on friday were certainly avoidable to a large extent however lets report as we have done.

Back to Normal next week.

Still trading 3 contracts. Volatility has come back into the market and the S&P has to make a big decision in the next few weeks - a new high or a lower low for a proper bear market. Any guesses?
 

Attachments

  • 16 may charts.png
    16 may charts.png
    32.8 KB · Views: 193
  • we 16 may eq.png
    we 16 may eq.png
    87.8 KB · Views: 188
When is a trade not a trade?

YM +300
EMD +300
ER2 +450
DAX -225
ESTX -110
SMI -190

Net +525 / 1,575

Another fascinating insight into trading today.
Any newbies out there are going to love this one!

EMD gave us a long signal yesterday on my OLD strategy at 891.9. (see chart)
The tradestation chart shows a high of 892 ie 1tick beyond our entry price BUT no entry on our strategy.
This happens every once in a while and I have never been able to get to the bottom of it.
Interactive brokers who I use to actually trade with have exactly the same print so there definitely was a trade at the whole number; so why does Tradestation not enter?
In this particular case Tradestation reports this as a successful short trade at 891.3 instead of a maximum point loss. One reason why you have to be a little careful with performance reports and strategy statistics.
It does only happen once or twice a year but it is annoying and no one ever seems to be able to provide a satisfactory answer. In real life we went long way before and that's what I have reported.

Mistakes made today:-
er2 and emd missed entry point by having spreadsheet open and not paying enough attention. Lucky to get entry on a pullback to the entry point.

Incorrect entry on SMI lost me a further 4 points (7711 instead of 7707).
Estx loss 3 points on first break of 3 minute high. Reported as full loss however.
Dax -1 didn't like price action saving max loss! However the strategy spreadsheet shows the official loss.

And Finally...

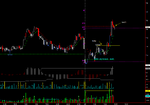
Did I make an error exiting the ER2 here?
Next chart gives the answer.
 

Attachments

  • when is a trade not a trade.png
    when is a trade not a trade.png
    37.4 KB · Views: 185
  • Stay or go er2.png
    Stay or go er2.png
    30.2 KB · Views: 185
Last edited:
ER2 Chart Outcome

Here's the result of the chart from the previous post.
 

Attachments

  • stay or go er2 outcome.png
    stay or go er2 outcome.png
    38.9 KB · Views: 184
Geting too clever so the market spanked me!

May 20

Ym 150
EMD 0
ER2 (60)
Dax 0 (error)
ESTX 0 (error)
SMI 600

Net 690 / 2,070

Initial entry on SMI suffered a big initial pullback - saw hammer candle and volume at 20 EMA but didn't enter short fully loaded (only 1 contract) - missed great opportunity.

ESTX had huge vol on entry bar - no trade. Entry required on economic figures release - no fill.

DAx - similar situation - the initial trade avoidance was good - then figures came in and I was left on the shore waving the boat goodbye.

I needed to hang on to the SMI trade, the economic figs caused a continued move down and really made the day trade wise. By then I had lightened up by 2 contracts however.
 

Attachments

  • may 20 smi plays.png
    may 20 smi plays.png
    52.7 KB · Views: 176
Last edited:
Learning lessons

May 21

Ym 308
EMD 500
ER2 280
DAx(25)
ESTX 500
SMI 10

net 1,573 / 4,720

If I had followed the rules today we would have made 2,200 per contract.
After yesterday we should have learnt the lesson but I just couldn't resist taking contracts off - and for a long time that was the right thing to do.
But once the fed had spoken this system ( and me!) have no way of re entry so the great evening run got missed.

On the bright side we did make good profits and tomorrow we trade 4 contracts. Another small milestone.

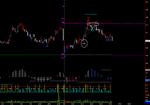
Today's chart is fascinating given the comments above - should I have added to the ESTX short here?
 

Attachments

  • may 21 estx add.png
    may 21 estx add.png
    34 KB · Views: 185
Estx Add to Short outcome

Stopped out on this one.
Just a little too early on the trigger.
 

Attachments

  • may 21 estx add outcome.2.png
    may 21 estx add outcome.2.png
    47.9 KB · Views: 179
  • may 21 estx add outcome.png
    may 21 estx add outcome.png
    32.3 KB · Views: 176
4 Contract wipeout

May 22

YM -250
EMD -110
ER2 -380
DAx -550
ESTX -100
SMI +10

Net -1,380 / -5,520

Well that's a great start to 4 contract trading!
The exits worked really well here strangely so not that unhappy. Our jump up to 4 contracts enhanced the loss however.

Avoiding big losses - which we did here - can help greatly. All our trades were effectively nick and runs so had we sat passively our losses would have been 3 times what they were.
Small crumbs of comfort but you have to take the rough with the smooth.

Tomorrow back to 3 contracts.

Today's chart is an example of exiting a losing position. I have marked the rule based exit (ie it's complusory that I exit) and also my real time one in this case. Lots of people complain that my stops are way too wide - and they are - but this system requires that the trade be allowed to breathe in and breathe out. And that always goes further than you would like. To get the big ones you have to take lots of small losses - its just the way it is.
My personal exit here is simply a lower high with a reverse signal from my other strategy programme. I would have liked an increase in volume so I did hesitate and NOT exit on the break of the Doji but the next break was a no brainer.
 

Attachments

  • er2 blog.png
    er2 blog.png
    49.7 KB · Views: 203
From wipeout to singin in the rain

May 23

Ym 105
EMD 100
ER2 10
Dax 1,483
ESTX 400
SMI 445

Net 2,543 / 7,630

The only disappointment with today is that we only had 3 contracts on and not 4 - because of the horrible day yesterday.:(
 
Equity nearly tripled in 48 trading days

Very good week - the only blot was thursday ironically where we upgraded our lot size to 4 and instantly took a big hit to drop us down to 3 for the big day following.
Net 10,475 for the week so shan't complain! However we did suffer a 9.77% Drawdown in the week - increasing contracts works both ways remember!

My feelings (for what they are worth) is that this has gone way too smoothly. In my real time trading I don't often get periods like this so I shall enjoy it whilst it lasts. Maybe, who knows I am getting better?:eek:
Nah, I don't think so either - it's simply that the markets are being kind to our system currently.


Soon I shall start talking about expectancy - just starting to get some semi meaningful statistics in but a little early just yet.
 

Attachments

  • blog we charts.png
    blog we charts.png
    20 KB · Views: 187
  • blog we numbers.png
    blog we numbers.png
    79.9 KB · Views: 211
Memorial Day

European markets are open today but I hope for some meaningful action tomorrow.
I am trading somewhere new tomorrow so I suspect I shall just be using my basic rules to get in and get out.

It is chucking it down here in West Sussex - so a great British Bank Holiday as usual :).
 
Very poor Trading by me Today

May 28
Ym -355
EMD No trade
ER" -100
DAX -575
ESTX 5
SMI -290

Net (1,315 )/ (5,260).

Lets talk about the negative first.
I got taken out of a great trade in the Dax. Just brought the stop in too close too early.
I have played with the idea of waiting for a Close beyond/at my stop rather than a high or a low and in this instance it would have made us a significant amount of money but on the whole I found it doesn't really pay.
The real lesson is to allow the instrument to wiggle.
What compounds my error here was that in real time I actually exited on the first breakout at breakeven as I did not like the price action - and then forgot to put the re entry order in - so that is probably worse.
Ah... move on Russell.

On the ER2 moving our stop very close saved us a fortune. I did this because my other day trading system gave a very strong Up signal on the breakdown.
It;s the 2nd most powerful signal it produces so always worth looking at.

A poor day then but more annoying than anything else.:(

Edit - Back to trading 3 contracts now - again!
 

Attachments

  • blog 28 may er2.png
    blog 28 may er2.png
    39.8 KB · Views: 192
  • blog 28 may.png
    blog 28 may.png
    44.4 KB · Views: 174
Drawdown continues

May 29

Ym 5+
EMD 10
er2 -100
Dax -575
ESTX 5
smi -290

Net -945 / -2,835

Dax was a horrible nick and run and caused the damage today.
EMD was a good signal but my other system interfered incorrectly today and got me out.
With no re entry order we missed a nice move there.
All in all a very frustrating day.
 

Attachments

  • emd blog.png
    emd blog.png
    40 KB · Views: 196
Well that was the Week that was..

May 30

Ym -150
EMD
ER2 60
DAX -300
ESTX -70
SMI 15

Net -445 / -1,335

Well let's look on the positive side - the week is over. Awful week with a complete run of losers.
Today was more of the same - nick and runs everywhere. Being caught in by horrible hammer candle bars (Dax) and high ticks and all sorts.

Even when we got runs (eg the SMI and EMD) we got taken out by our protective breakeven + stop and even worse a manual override of the system to miss the final trend of the day. Damaging to the bottom line and the psyche!

We are currently sat on a 26% drawdown but still trading 3 contracts.
 

Attachments

  • emd blog.png
    emd blog.png
    39.2 KB · Views: 166
  • smi blog.png
    smi blog.png
    38.7 KB · Views: 199
Worst week so far.

System lost 15,080 this week (pos sized) and we are currently experiencing a 25.74% Drawdown.

Worst week by far and cruel in that we suffered 5 day losses in a row.
It can get worse ( historically the worst run was 9 days) but it is fairly unusual.
The kind of week where you just wish you had played more golf and left the screens!

Looking at the positives - the last 3 losing days we only had 3 contracts on and not four - hence reducing our losses.

The idea behind trading multiple instruments is that we try and avoid losing days but this week we lost when we went short and long on different instruments in the same day.

Lots of people will mention correlation at this juncture. ~And it is true the indices are highly correlated - but not as much as you would think.
For example thursday where we were short in Europe and long in the USA. (And still came out negative on the day!)
If you try and make sense of it by normal techincal portfolio theory it won't make sense - but we are here to make money not sense.

Lets look forward to next week.
Bring it on. :)
 

Attachments

  • we 30 may eq.png
    we 30 may eq.png
    76.4 KB · Views: 165
  • charts 30 may.png
    charts 30 may.png
    20 KB · Views: 181
Hardware Crash & Lightning strikes

In the middle of trading yesterday my hard drive decided to go bang.
These things happen. Trading off my laptop is very difficult after 3 screens let me tell you!

What I had not expected was that my tradestation backup archive only held the prior version backup ( I automatically schedule a backup every 2 weeks).
So I am going to have to re install a prior version of TS onto my new hard drive (which arrived this morning ) to then restore a backup there. Then re install the current version which will swap whatever it has to swap over. (Fingers crossed).

Since I started trading the house has been hit by lightning (twice!) which caused the first hard drive to burn up and now this - in only 5 years.
My next purchase is a UPS ( uniterruptable power supply ) which I beleive may give me some extra protection against lightning and other power surges.

Any comments welcome on that.
Therefore - no blog today.
 
Top