Mechanical Trading Intra Day

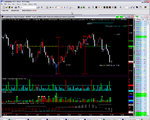
Beneath our start equity

March 27th

YM +355
EMD - 730
ER2 -900
DAx +275
Estx +10
SMI -300
Net -1,290 New Equity 19,495

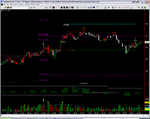
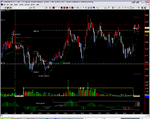
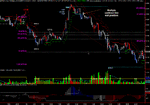
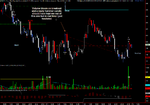
I have found that entering on trends that are sharp and have already run 4-5 bars is not a good idea generally (see chart).
There are loads of signals to say don't do this trade but mechanical trading is about taking every trade. You should not decide in the heat of the market what to do - that's why you have a plan. I am fairly fluent in EAsy Language (Tradestation's coding language) but my efforts to avoid these kinds of trades MECHANICALLY have so far failed to bring fruition.

Dax had nearly 2,000 in open profit at it's height - again very irritating. Similarly SMI was well into profit but it didn't hit my minimum profit band (cyan line on each chart) so we had to take a loss.
This system relies on trends persisting and sometimes they do not.

Note the volume on our entry bar of YM (chart) - its normal to get a volume bloom at the breakout of a significant line but there is no significant line at our entry point - hence the discretional part of me says only enter with half your position. I used to NOT enter - which was highly successful right up until I missed the monster of a trade which was the biggest last year. Always improving.
The best description I heard about system trading is that it's like a mobile - touch one element and all the others shuffle round and alter.
I know anyone reading this would now be feeling a little nervous - all these big loses piling up. But don't worry. It happens.
 

Attachments

  • eq mar 27.png
    eq mar 27.png
    51.1 KB · Views: 169
  • mar 27.png
    mar 27.png
    68.1 KB · Views: 172
Last edited:
Small profits and Dr Clayburgh

Ym +475
EMD +480
ER2 +600
Dax -600
EStx -250
SMI + 185
Net 890 New Equity 20,155

Dax was the big loser again today. In reality I did not enter this position - again because the entry is coming after an 8 bar up trend. It just has to take a rest, so I waited for the pullback and then got the worst kind of candlestick with big volume. Now I actually shorted this but this blog system can't do that so we report it as a loss.
Now let me explain about the Clayburgh line. Dr Clayburgh trades and sells all sorts of indicators and systems which are not for me BUT from his web site you can have a FREE Directional Day filter indicator which is the line made up of crosses on the chart.
This is my OWN interpretation of that and I have found it very useful.
It assists in looking at the big trend of the day so you can't use it as a timing device. Essentially I look at it as a sort of barrier zone. Crossing it is never that easy. If it does, it often (but not always) signals a change of thought by the market.
It's very simple but once you see it in a few charts the penny usually drops!
My coding is still a little off re the colours, the crosses should be green here for instance, but it is only used as a guide. Here it saved us from the bigger loss ("Loss" exit on the chart ) which I find is one of it's most effective outcomes.

NB to save time I am only going to show the equity spreadsheet each friday from now - or when we change position size.
 

Attachments

  • mar 28.png
    mar 28.png
    44.1 KB · Views: 181
  • eq mar 28.png
    eq mar 28.png
    60.6 KB · Views: 162
Last edited:
Lets Define Discretionary

For the purposes of this blog the only alterations I will make to the mechanical system are ones I note in real time. It's no good saying "Ah, I would have got out / taken a profit there" I have to have noted it on my chart. I don't always display these charts but you have to have some trust!

I learnt this from moving over from paper trading at which I was really quite successful. Whole charts are nice and easy to read - in real time, however you trade the hard right edge and pattern recognition is a whole leap in complexity.

So, a tip for any new/ wannabe / struggling traders out there - if you don't note it on your chart in r/t - you didn't do it! Trust me it's really hard when you miss the blindingly obvious patterns or ( and I frequently still do this) you exit a profitable trade WAY too early on what turns out to be a minor pullback.
For the psychologists / philosophers out there I found the minute I had to actually write down on a chart what my position was RIGHT NOW the anxiety shot up. Because trading is unlike any other area in life except gravity, you can't negotiate, sell , coerece or persuade gravity to do anything - it just is. The market is exactly the same. Those "lets go long here" comments on the high tick of the day are humbling BUT they do teach you if you are prepared to listen. Also in trading you are right or you are wrong (if you think this way). There is no inbetween. Seeing it written, by yourself , for the 3rd time in a row that your pattern didn't work out profitably is plain hard.
Oh and then of course there's the time where you moved the stop just to give it a few more ticks of wiggle room, well just a few more coz it's got to turn here, well it can't keep going this way..... ....................................................
can it?......................................................,
.............................................................
now I am just going to tough it out....................
.............................................................
this market is not going to beat me.... .........................................................
..............................................................
..............................................................
..............
where has all my account equity gone?
 
Last edited:
Ooh the pain of a drawdown

March 31st

Ym +155
EMD 0
ER2 +10
DAx - 1850
ESTX -340
SMI -750

Net -2,775 New Equity 17,380 (DD = 31% from peak)

Great instructive charts here!
Ym had a nice exit ( we took a little more than the mechanical Breakeven exit) and a real beauty of an exit on the DAx which we ignore for the purposes of this system testing.

Good times will come trust me! I would like to increase my position sizing here as 30% DD's are usually somewhere near the top but that would be foolish.
If I wanted to start the system with real money Tuesday would be the day - really!!

PS I wrote this on Monday night but forgot to post it until today.
 

Attachments

  • dax march 31.png
    dax march 31.png
    39.9 KB · Views: 182
  • ym march 31.png
    ym march 31.png
    41.6 KB · Views: 174
Last edited:
8k per contract

April Fool's Day
Ym +715
Emd +1050
ER2 =65 0
DAx +3600
ESTX +1200
SMI +1150

Net +8365 New Equity 25.885

Not much you can say about a trending day other than stay with the trade!
These days when everything goes like a rocket are rare so lets enjoy it.
Now the real test is that tomorrow we trade 2 contracts - crikey!!
 

Attachments

  • april 1 er2.png
    april 1 er2.png
    37.8 KB · Views: 228
Last edited:
Discretion saves a bath

April 2
Ym +5
EMD -210
ER2 -100
Dax -825
EStX -385
SMI +400

Net -1,115 (single contract) Equity 24,770 (+19%)
Net -2,230 (position sizing) Equity 23.655 (+18%)

Note the divergences on the two charts which prevented us taking the larger part of these heavy losses . The mechancial system however reports the full loss and as we were trading 2 contracts it hits us harder!
Now back down to 1 contract.
 

Attachments

  • 03-04-2008 07.37.29.png
    03-04-2008 07.37.29.png
    56.8 KB · Views: 201
  • 03-04-2008 07.40.04.png
    03-04-2008 07.40.04.png
    66.3 KB · Views: 207
Last edited:
Elliot waves in the Dow?

April 3rd
Ym +5
EMD +10
ER2 -460
Dax +13
ESTX +5 (slippage and cost allowance)
SMI -200
Net -628.
Single contract equity 24,243
Pos sizing equity 23,028

Another frustrating day in that we had large open profits that all turned to dust. In times like these it's tempting to change the system and tweak it a little.

ER2 was instructive today. The entry point came right at yesterday's low and in reality we came out with a smaller loss after the break of 'a' on the chart.

Ym shows how the breakout just couldn't hold but for all the Elliotician's out there this could be a wave 2 pullback of a larger degree uptrend. WE shall let the price action decide that overnight and tomorrow.
 

Attachments

  • april 3 er2.png
    april 3 er2.png
    39.1 KB · Views: 189
  • ym april 3.png
    ym april 3.png
    46 KB · Views: 186
Last edited:
Week 2. Portfolio +15%.

Yesterday we made $8 but again we had open profits on the portfolio of $800 at one stage. All very frustrating. However our breakeven stops worked brilliantly to prevent profits going to quite large losses.
So that is a positive!
The chart today includes a new indicator I am currently looking at called RSI Bands. If you are a tradestation user the code is posted here.

I don't use a ton of indicators but it's always nice to research them. This looks like an interesting twist on the usual RSI indicator and of course it can be applied to any oscillating indicator , not just RSI.

Up $2,880 on the week, but still in a drawdown of around $2,850 from our peak equity. Portfolio is up 15% from our start equity.
 

Attachments

  • equity figs week ending april 4.png
    equity figs week ending april 4.png
    83 KB · Views: 276
  • smi april 4th good be.png
    smi april 4th good be.png
    38.9 KB · Views: 194
Last edited:
Back to square one and some software issues

April th
Ym -300
EMD -420
ER2 -500
DAx -600
EStx 5 (Breakeven)
SMI -310 Net -2,125

Single contract equity 21,908
Pos Size equity 20,793

We are just not getting the right runs of trades yet. Patience is obviously required.
These are the days it would be great to avoid - all nick and runs - see previous posts for that definition.

Nice illustration of where software / my coding? can let you down today though.
 

Attachments

  • er2 blog code error april 7.png
    er2 blog code error april 7.png
    67.9 KB · Views: 204
Last edited:
just noticed your blog here russell. v.good and i will keep reading with interest. jules
 
Keeps me disciplined having to "report" the trades.
All feedback welcome!
I am tinkering with the system behind the scenes but it takes huge amounts of real time testing for me to change anything. So often what appears great for 3 months eventually ends up adding nothing to the bottom line long term.
Bit like trying to reduce your Golf handicap really....
 
It just gets worse and worse

April 8
Ym -230
EMD +10
ER2 0
Dax 0
ESTX -220
Smi -240

Net -680

Ah this is annoying. Our Dax breakeven stop again saved us a further 600 loss but the market is mean reverting at the moment and not giving us the trends we need.
On to the next trade.
 
Last edited:
Discretionary day

April 9
Ym +5
EMD +800
Er2 +880
Dax +450
Estx -120
SMI +10

Net +2,025

Yesterday we nailed the exit on the Dax. (See chart)
Had we known this would be the start of a monster downtrend it would have been nice to have gone short but ask yourself looking at chart 1 if it really gave much hint of what was to come?
This moved Dax up from breakeven to a much nicer +450.
I have to say it was slightly lucky as I rarely exit a position like this - normally I like to exit only half the position and let the rest run it's normal course and that is one of the major problems in trading 1 contract - it's all or nothing.
Till tomorrow!

Edit - yest high is the dotted red line on the chart
 

Attachments

  • exit half on dax april 9.gif
    exit half on dax april 9.gif
    53.9 KB · Views: 211
  • exit half on dax april 9 1.gif
    exit half on dax april 9 1.gif
    49.2 KB · Views: 227
Last edited:
2nd day of profits

April 10
Ym +5
EMD +580
ER2 +80
DAx +1100
ESTx +170
SMI + 635

Net 2,570
1 lot equity 25,823 Pos size Equity 24,708

Popped along to a training day yesterday with a relatively new company in St Albans. Always interested to see what others are doing. So impressed I even signed up for one of their courses - must have been a rush of blood to the head!
Anyway what I liked was they actually have a real live trading room and trade the hard right edge of the chart. None of this here's what you should have done on an old chart (which is easy).
I spend an average of 3-4k per year on books and courses, training, etc. I find it helps to keep up with what's new and there is always that element of "ah yes I had forgotten about that" :idea:
I toodle off in May so I will let you know.

My new electric golf cart arrived yesterday - so surprisingly I am out playing golf later today. Can't wait!
 
Last edited:
Week 3 - Portfolio +20%

Frustrating week of missed opportunities really but always nice to bank profits.
Disappointed with SMI - so far it has managed to add
-$55 to our account in it's 19 days in our portfolio.
Similarly ESTX50 is -$515 for the same period.
Ironically ( and I say this from experience) - the Dow has been the star performer at +2,630.

I would like a nice set of straight breakouts please Mr Market. Thank You.

PS After a while I will add some charts of our equity but at the moment there really isn't enough data to make it meaningful. Plus I am experimenting with what works on the blog and what doesn't.
if anyone has any preferences please comment.
 

Attachments

  • blog equity weekly april 11.png
    blog equity weekly april 11.png
    96.9 KB · Views: 192
Last edited:
Real time trading Charts

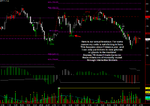
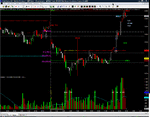
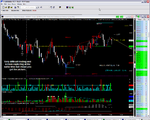
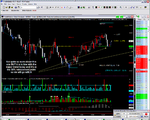
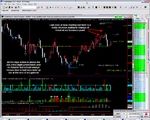
:clap:I find tape reading very difficult and I would be the first to say I am quite poor at it . But every now and again it comes together and this sequence of charts shows what I was thinking and how I played it out.
Importantly it prevented (so far) a loss on the dax on our standard breakout system
I would be quite prepared to re enter this long later though.

Tomorrow I am away at a mechancial traders group meeting so I will be unlikely to blog.

PS apologies for the slightly messy charts but these are what I use when I am screen watching.
 

Attachments

  • 14-04-2008 11.01.13.png
    14-04-2008 11.01.13.png
    116.2 KB · Views: 191
  • 14-04-2008 10.51.27.png
    14-04-2008 10.51.27.png
    145.8 KB · Views: 198
  • 14-04-2008 10.50.27.png
    14-04-2008 10.50.27.png
    153.6 KB · Views: 211
  • 14-04-2008 11.27.44.png
    14-04-2008 11.27.44.png
    110.8 KB · Views: 192
Last edited:
Grinding our axes.

April 14th

Ym -270
EMD -310
ER2 +50
DAX - 0
ESTX -180
SMI 0

Net -710

Well our view on the dax breakout saved us 600 of loss - marvellous. ( see previous post) Avoiding the losses really helps the equity curve.
All the other trades were of exactly the same type - entry long, go up for a point or two and then spend the rest of the day going down.
As I hardly touched any of the others in real time I have included these as full losses. I did not want to be in EMD but I can't really say why - just a feeling with the volume bloom and the hammer candle , however if unsure one has to just follow the plan. Shame.
 

Attachments

  • ian.png
    ian.png
    57.2 KB · Views: 213
Last edited:
Sometimes you get lucky

Went to my system traders meeting today and decided I was not prepared to just leave the system running blind.
Even though there are 2 hours to go to closing I am quite glad I did. Horrible system day.
More tomorrow....
 
Last edited:
Top