Mechanical Trading Intra Day

Yesterday

Well, whilst not patting ourselves on the back we were saved from a drubbing yesterday.
I had decided not to trade purely automatically yesterday as the markets have been very volatile and very unfriendly to our breakout system. It seemed sensible to just take a day off - now this is not in my trading plan but sometimes you have to go with what you think. I was quite prepared to go with losing out on a big win as well but not being here and not really having any platform access I simply assessed the risk as too high. I did watch the European markets for about an hour and a half on the open and it was all a bit "random" as my teenager daughter tells me.
Net result we were saved from a loss of 2.320.
Phew!:cheesy:
 
Last edited:
USA 1 Europe 0

April 16th

YM +370
EMD +670
ER2 +270
Dax -700
ESTX +15
SMI -400

Net +225

Ah what could have been. European markets all went for a great long trend but we were short. US markets saved the portfolio by putting in v good performances.
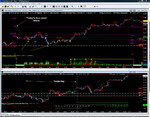
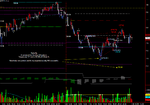
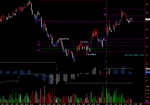
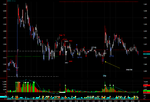
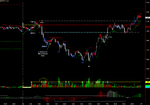
Today's chart shows the importance of looking at the bigger picture - in particular yesterday's important pivot levels.
The floor pivot levels are marked in magenta but the two white lines are where the market made significant turns the day before and voila - where do they turn tomorrow. Doesn't always work of course ( that would be way too easy) but it pays to have them on your chart.
The system is becoming increasingly frustrating - a sure sign things are lining up for a biggie.
 

Attachments

  • blog april 16.png
    blog april 16.png
    104.1 KB · Views: 223
Last edited:
Choppy day

April 17

YM -50
EMD -360
ER2 0
Dax -700
ESTX +75
SMI +445

Net -590
1 lot equity 24,163
Pos size equity 23,048

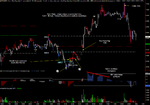
Smi saved the day here - otherwise the loss would have been much greater.
EMD gave us a nick and run - just got us short and then spent the rest of the day taking money off us.:mad:
Pleased with the manual exit though.
 

Attachments

  • blog april 17.png
    blog april 17.png
    33.6 KB · Views: 208
Told you a good day would come!

April 18th

YM +180
EMD -190
ER" -150
Dax +2438
EStx +415
SMI +1185

Net 3,878
1 Lot Equity 28,040
Pos Size Equity 26,925

Well a bonza day! (See April 17th post)
Difficult issue today is staying with the trade.
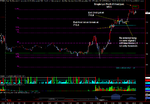
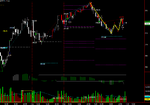
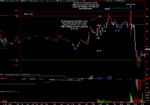
What works really well for me is to go up a scale in time - see the 15min chart below.
I have to say in real time this is very difficult; but this system particularly relies on outlier type days like this. So you have to see the trend through to the end.
Monday we are back to 2 contracts so we really need a positive day there to heave us over the 2nd contract bar.
 

Attachments

  • april 18.png
    april 18.png
    38.4 KB · Views: 203
Last edited:
Week ending April 18th

Week was saved by Friday which dragged us from a net loss into a profit of 2,803 for the week.
First calendar month and the portfolio is up 34% with a max drawdown of 31% peak to trough.
Single lot trading is up 40% so outperforming our position sizing management so far.

Monday becomes a very important day because we again move from trading 1 contract to 2 contracts BUT it also gives us the ability to half our position if we are not happy, etc.
On a much more important note I have just got back from being drenched at Golf - a miserable round and shot 7 over my handicap - disaster http://www.smileycentral.com/?partner=ZSzeb001_ZN
 

Attachments

  • eq we april 18.png
    eq we april 18.png
    132.7 KB · Views: 239
  • Eq chart april 18.png
    Eq chart april 18.png
    16.5 KB · Views: 190
Last edited:
2nd Day of profits

April 21

Ym -130
Emd + 210
ER2 -420
Dax +850
ESTX +150
SMI +600

Net 1,260 single lot , 2,520 pos sized

Gave a lot back today. No pics today - bit busy.

I mean yesterday obviously, see - too many things at once - can't multi task.....
 
Last edited:
Discretionary exits win the day

April 22

Ym +75
EMD +600
ER2 +600
Dax -350
Estx -155
SMI -310

Net 460 / 920

Could have / should have done a lot better with the European indices this morning. All had reasonable open profits but none quite hit the breakeven level.

With that in mind I was determined not to let the same thing happen in the afternoon. The EMd and the ER2 both just cascaded down for very healthy profits - 1 exit at a near perfect bottom and the second leaving a little more wiggle room 'hoping' the trend may continue - which it didn't.

So as teacher's report would say " Could do better"
7/10.

My other machine is closed now so I can't upload the screen shots I took - will do that tomorrow
 
Last edited:
4th Day of New Equity Highs

April 23rd

YM + 43
EMD +70
ER2 +180
DAX -725
ESTX +200
SMI +550

Net 318/635 (pos sized)

I always find these strings of wins worrying - the drawdown is sure to come so brace yourselves.
The great news is we are well into the 2nd contract area now so lets see if we can stay there.

A day of contrasts with wild gyrations both up and down so not so friendly to a trend type of system.

But here is something important.

If we separate the European trades from the USA trades we find that at 1220 (UKTime) we had the maximum open profits of 2,560 on the SMI and the ESTX (2 contracts each).
The loss on the DAx had already happened.

At 1600 ( just 30 minutes after our entry ) in the US trades we had open profits of 2,690 ( again 2 lots).

Had we been the perfect trader we could have exited today with approx 3,500 - including the Dax loss, which of course as a perfect trader we would have cut off much earlier anyway.

A sobering thought is that we ended up with less than 20% of the maximum profit available which seems downright poor.:mad:

My friend Peter has done a ton of analysis on reducing risk in these frenzied type situations and discovered some real edges. My goal this year is to try and replicate that anaylysis and find some edges intraday.

As it involves Portfolio analysis - Tradestation is not tremendously helpful here ( it can only backtest 1 instrument at a time) so I am having to code up exporting data into excel and work there.
Such fun!:cheesy:

If anyone reads this and has some help - please pm me!!
 
Last edited:
Blue Period

April 24th

Ym +75
EMD +450
ER2 +570
Dax +125
ESTX +50
SMI -150

Net 1,120 / 2,240 (Pos sized )

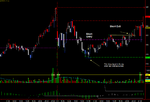
Again a good day but maximising profits proved very difficult and my undoing ( see chart ).
I exited way too early and left profits on the table. At least I re entered to gain a bit back but exiting way too early is a BAD thing to do.
 

Attachments

  • blog er2 exit error april 24.png
    blog er2 exit error april 24.png
    61.2 KB · Views: 188
Huge Swings and change of Trend

April 25

Ym +50
EMD -60
ER2 +30
DAX 200
ESTX +10
SMI -50

Net 180 / 360

Strange day and given the weekend I may come to a comprehensive view - but the market went down and then closed very strongly up.
Fortunately we got signals to go long whilst short thereby exiting our shorts (not going long note) and saving our capital for another day. The Dax is a good case in point. It was up nearly 50 points before dropping back to way below our entry point. So a graceful exit to bank 400 seemed a sensible solution.
It's not much given we were up a max favourable excursion of 1250 per contract but hey who said trading was easy? I still feel I should have done a lot better.

But lets not knock a great week - we banked profits every day this week and that is very rare!
 
Week 5 Portfolio +68%

Portfolio is up 6,675 this week to a total gain of 13,600 (position sized ).

Total Equity 31,378 Single lot
Total Equity 33,600 (+68%) Pos Sized

Net gain a very healthy 68% total.

Had we played this correctly I feel we should have been over 100% so let's see if we can improve over the coming weeks. We had a huge amount of open profit that we left behind and I will do some research on this over the coming months.

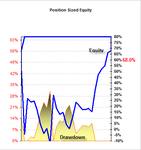
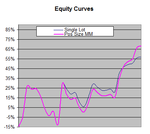
I attach a chart of our equity curves - single lot vs our position sizing. As you can see the single lot did better in the drawdown when we went from 2 contracts back to 1 contract on the position sizing; but is now losing out as we leverage the profits with 2 contracts.

We are in fact close to adding a further contract - which is at a total equity of 36,350.

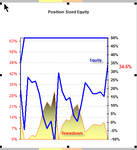
I also attach a graph of our equity vs drawdown which illustrates how parabolic this week has been - equity curve is just going straight up. Without wishing to be negative this cannot continue so we expect the drawdown and our job as traders is to control that drawdown as much as we can whilst remaining true to our rules.

I have found the most important thing in trading is not handling weeks like this one just been - but handling the losing weeks equitably.

Succesful trading everybody.
 

Attachments

  • april 25 eq dd.png
    april 25 eq dd.png
    17.3 KB · Views: 174
  • eq we 25 april.png
    eq we 25 april.png
    150.3 KB · Views: 202
  • eq single vs frff.png
    eq single vs frff.png
    9.2 KB · Views: 172
Last edited:
Butterfly Pattern & Elliot Waves in ER2

April 29

Ym -120
EMD +50
ER2 +175
DAx -100
ESTX -65
SMI -40

Net -100 / -200

Disappointing day. Big trends down that stopped just as we entered effectively - and proceeded to reverse direction on us.
Portfolio saved by a timely exit on the Russell and the S&P Midcap 400


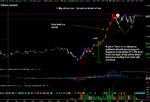
Interesting pattern on the ER2 a butterfly pattern which was a pig to code up and in my experience not that successful a pattern either - and relatively rare to boot.

A butterfly pattern must have a minimum 76% retracement (In this case it's 84%) from the impulse leg.

I think this one may work because

1. It looks like a potential Wave 3 start (Elliot Waves). More importantly its the first correction off a big impulse wave down. Any Elliotician's out there feel free to comment as it's not my forte.
2. The pattern actually looks like a butterfly - nice and even with a good shape
3. Large volume right near the crescent of our entry (720.2).

However the very large volume 4-7 bars before the end of the chart is not good.

I don't trade this - but it's nice to know it's there.
 

Attachments

  • er2 butterlfy april 29.png
    er2 butterlfy april 29.png
    51.2 KB · Views: 189
  • er2 butterlfy april 29 bigger pic.png
    er2 butterlfy april 29 bigger pic.png
    47.1 KB · Views: 185
Last edited:
Butterfly update

" I think this one may work because

1. It looks like a potential Wave 3 start (Elliot Waves). More importantly its the first correction off a big impulse wave down. Any Elliotician's out there feel free to comment as it's not my forte.
2. The pattern actually looks like a butterfly - nice and even with a good shape
3. Large volume right near the crescent of our entry (720.2).

However the very large volume 4-7 bars before the end of the chart is not good"

(n)
Clearly the volume was more important than the pattern in this instance!
 

Attachments

  • butterfly update.png
    butterfly update.png
    32.9 KB · Views: 215
More Profits but an error made

April 30

Ym +10
EMD +10
ER2 -200
DAX +375
ESTX +65
SMI +220

Net 480 / 760

Well the economic figures and FOMC announcements certainly caused some volatility today didn't they?

Unfortunately all of our mechanical breakouts were the wrong side for this new information so I had to essentially exit positions manually to protect profits. All of the breakeven exits kicked in but having 2 contracts allows me to take reasonable profits on half the position if I see something I do not like.
Slippage on the ER2 - trying to exit 3 minutes after the FOMC announcement was horrible and essentially accounted for all the loss.
Should have exited at the DP Signal at yesterday's high but for some reason I didn't :(
 

Attachments

  • dax aprl 30.png
    dax aprl 30.png
    69.6 KB · Views: 169
  • er2 april 30.png
    er2 april 30.png
    56.6 KB · Views: 173
Portfolio just nudging 100% increase after 6 weeks

May Day

Ym +735
EMD +530
ER2 +670

Net 1,935 / 3,870


May Day over here so no European exchanges open today.
However I have found in the past that these exchange holidays or "quiet" days can be tremendous. This doesn't rank as tremendous but pretty damm good!

This was simply a case of put the trade on and ride the trend. Took some profit on YM when it peaked over 13,000 - its a massive psychological figure so you know it has to be tested and re tested.

Similarly this allowed profits to be taken on the first of our 2 contracts on ER2 and EMD - just follow my leader, really.

A very nice day with little stress!

Tomorrow we trade 3 contracts - hurrah! The ability to play with the strategy increases further still. I would add this can be quite dangerous at times and exits MUST be based on some technical pattern or reason. There would be nothing worse than taking 2 contracts off at say $500 each only to watch the last one rocket to a profit of $2,000. That would be psychologically devastating as you have lost $3,000 by missing the outlier event that we are waiting for.


Onward....
 

Attachments

  • blog ym may 1.png
    blog ym may 1.png
    67.5 KB · Views: 165
Oulier Events - what they are. Cautionary Word.

An outlier is a rare event but makes a huge difference to a trend following strategy, sometimes called a 5 sigma event, 50 year storm, etc, but as Mandelbrot has found in his superb book events (plural) have happened in the S&P 500 index in its 35 year odd history that should have only happened once in 10,000 years - the market is not a "normal" distribution of events - it is subject to wild fluctuations of emotions - fear and greed, people.

On the cautionary front - we are in a blue period for this type of strategy. It's all too easy at the moment so don't for a second think this is normal trading!
The drawdown will come and our job is to try and avoid as much of it as possible whilst allowing the strategy enough room to breathe.
 
We woz robbed :)

May 2nd

YM +305
EMD +300
ER2 + 480
Dax (400)
ESTX (200)
SMI + 610

Net 1,095/ 3,285 (pos sized) 3 contracts now

Well here's a thing! Nasty nasty market and automated trades and other traders and everything. Not that trading gets you emotional or anything ; but just look at this evil trade on the Euro Stoxx 50 future.

There are 2 mistakes here -
1. I had thought the non farm payroll figures were 1500 not 1330 - hence unprepared.
2. not getting out immediately - and I mean to the second I realised what was going on ( the activity on the order book is a wonderful thing to watch when figures come out).

Long and short we got stuffed - we will make these mistakes - they are part of trading - and in fact we complied with the rules of the system - short on the breakout with a stop the other side so I don't beat myself up too much. Good news is we saved a tick on the exit - pure fluke of the way the order book ran at that particular nano second.

Good news was the other contracts.
First the Dax - here was a lesson in discipline. It took us to within 1 tick - yes 1 tick - of our stop but did not trigger it and then went scaling up with the same figures release that screwed up the SToxx 50 trade.
I had exited 2 contracts prior for a loss of 18 points (x2) as it had broken my trailing stop. I tried to get back in when the figures came out but the SToxx contract took all my attention. The last contract stayed on to the bitter end and once we had $1k in open profits I trailed the stop again to get out at the break of the lower high formed around 1505. (profit 28 points x1). So net position was down 200 with commissions but it should again have been better. Not great trading .

The SMI trended very nicely if not very steeply and we took 2 off at 7656 for a profit of 32 points each and left the last one on until the end of the day for a profit of 50 points.
Had we not messed about with exits we would have increased our profits by nearly 3k in the European indices.

The USA indices however trended v nicely indeed and gave us some handsome profits again. This run is like nothing I have experienced before - we are now into our 10th new equity high in 11 trading sessions.

Still as our report card would say - could do better.

Edit - in case anyone is wondering - you can't trade the European Indices through Tradestation. However you can take the signals and automate them through Interactive Brokers. You can automate and trade the USA Indices however through both IB and Tradestation.
 

Attachments

  • may 2 estx nasty entry.png
    may 2 estx nasty entry.png
    74.8 KB · Views: 196
  • smi may2.png
    smi may2.png
    42.2 KB · Views: 193
Last edited:
W/e May 2nd

Well the garden is looking rosy!

Portfolio is now at a very healthy 110% of start equity and the nice run of profits we have had has exploited the increased contracts we have placed to it's maximum.
The difference between trading a single contract and using our position sizing is outlined in the second graph - around 35% difference.
 

Attachments

  • we may 2nd pics.png
    we may 2nd pics.png
    21.4 KB · Views: 206
Leaky day

May 5th
YM -135
EMD 0
ER2 -280
DAX +25
ESTX -130
SMI 0

Net -520 / -1,560

The Estx50 did it to us again - nicked in on a figures release and then bang straight out in 3 bars. Ouch.:mad:

Yesterday was a drifting sort of day. AS I wasn't around for a large part of it the losses were slightly
higher than they could have been but there simply wasn't a lot of profit to be had.
 

Attachments

  • estx deja vu.png
    estx deja vu.png
    43.8 KB · Views: 217
Last edited:
Good profits but more mistakes made!

May 6th

YM +390
ER2 +200
EMD +600
DAX +413
ESTX +650
SMI +140

Net 2,393 / 7178

I made a major mistake today but got away with it.
The Dax had broken down out of its' range and I was happily short but then I thought I saw climactic volume and strength in the price bars.
I then exited 2 contracts instead of one by error. Of course the Market did pull back but then tanked back down and now I am only in for 1 contract.
It then proceeded to go to a maximum further gain of 1,125 of which with standard exits we should have gained 500 per contract.
However the market then completely reversed and went way back over our entry point which was a huge surprise.

YM had huge resistance at 12,995 which it finally managed to overcome at 1950 (UK Time)
 

Attachments

  • dax may 6.png
    dax may 6.png
    35.1 KB · Views: 194
Top