Best Thread learning to read price action with p/f charts

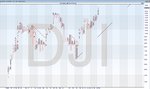
aussie dollar...commodity currency
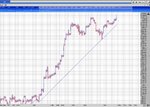
audusd H4 data from 15 april/approx
a very steep downtrend
that gets tested in .9400 area
43 pips by 2 reversal
npgeix.gif
 
that is why you must take into account the whole trend
so..on some charts you need to go higher to get the whole trend on the screen
then you can bit down into segments
so.scanning on a 2% is a bit silly as in alot of cases,especially since the QE start..many charts cannot fit on the screen,even on 2%/close with a 3 reversal

my chart goes back to 1995! I just took a small picture. i normally work off 1% or 2% charts, have never thought higher. Its not that I didnt have the information its just there is going to come a point where you could find support anywhere, just by using a different setting. Anyway, wise words as always and good spot on the higher the timeframe
 
amec
a closer look at the price action
imho..there was no real change of trend.there was a p/b in oct 2011 to horizontal supp.but no p/f signal /short near that trendline...so longs should have been re initiated
purple horizontal was maj res,then it broke up to res and is now in a range.you can see at month numbers 7 and 4.that should provide major supp
2rwomd2.gif
 
a closer look at the trend the green line on the previous chart
the last push upwards from the 700 area low in oct 2011
the whole situation is getting quite interesting
it tested trend support and bounced.now we have minor overhead res/red line and above is horizontal res/prev res area.the range is getting squeezed ,so it might pop...could go either way
any results? news coming out ??

332nxc0.gif
 
hence.......
i aint a big fan of scanning on a specific box size
the main trend should be placed on the chart first...so if it means going to a 4% box size,so be it
so tne chart should really be THAT trend and very little else
then you can break it down into intermed and minor trends and place things like fibs/counts etc more accurately
imho

food for thought, let me ponder on that.
Let me just say, I dont scan. My preferred timeframe is 1-2%. Thats what I trade off. A double top on a 1%/2% depending on how well the bullish support fits is my preference. I generally have a small watchlist, but Amec came to my attention due to the weakness on the 2% chart
 
eurusd as we go into nfp
in a downtrend within a consolidation
H2 data
support is at 1.2990 area then plenty of horizontal support from early june
trend res is at 1.3170 and 1.3080 areas,aswell as horizontal res
we could add a fib.but not really necessary.there is plenty of information from this chart
21sxns.gif
 
gbpusd
H1 data
shows the downtrend that started in mid june
it has 3 downlegs.the last started yesterday/Carney
so we can go to 5 min data and track that latest downtrend
imnhg4.gif
 
just playing with another platform, which has lots of Dow history
compare 2% chart with data from 1995, and it looks like we have been up, down, up, down then up again
compare now with data going back to 1981 and you have one long uptrend and lovely running bullish support
 

Attachments

  • dow 1995.JPG
    dow 1995.JPG
    328.4 KB · Views: 206
  • dow 1981.JPG
    dow 1981.JPG
    348.3 KB · Views: 192
I've never tried applying pf charts to anything but daily bars and above. Has anyone had success with pf charts on 5 minute bars? Or intraminute bars? Just wondering, I always want to explore new possibilities.
 
I've never tried applying pf charts to anything but daily bars and above. Has anyone had success with pf charts on 5 minute bars? Or intraminute bars? Just wondering, I always want to explore new possibilities.

they can be used (and were originally developed) for intraday timeframes.
almost all of Dentist's charts are intraday...
 
I apologize for being so non-observant here. Pf charts always interested me but I have no experience with them so far. I was thinking that the boxing effect of pf charts may lend them to be perfect as a stop loss placer, I plan on exploring this over the next month or so and will post results after I test.

Cheers

don't apologise, i wasn't trying to be supercilious it was just a statement. My advice if you wanted it, would be to do just what you suggested..get some experience with them and take a look at the basics of them, either at the beginning of this thread or anywhere really
start trying to apply them. Their stops are really good, but their strength lies in the way they define a trend for you. very objective. along with adaptive support/resistance levels and then their targets. so accurate
good luck, and ask away if you need anything
 
Thanks. I am close to getting my system where I can turn it on and walk away but I still am trying to satisfy a couple issues. I'm sure I will have many questions when I am deeper into testing.

Cheers
 
Dentist, help me understand something please
http://www.trade2win.com/boards/indices/120172-anyone-scalping-ftse-futures-3238.html
I wanted to post here as its off topic on the FTSE thread
Your chart of the 10x3 high low shows we are looking at an uptrend, which began on24th/25th June
On a close chart for the same time period, then we are technically looking at a downtrend.

If i chose just the last 20 days trading on a close chart, I am looking at an uptrend..
if we are trading intraday, why would I look to see whats happened weeks ago, surely I would only be focusing on the current action..
can you see where I'm going with this?
Ignore daily charts, as I want as much information as I can get, its really the subtle changes intraday I want to focus on
thanks mate
 
cos....
i have taken the high of the last up column and not the high of 6870 made on 22nd may
according to the book
if you think its made a high or a low...you can draw a 45 deg trendline from that top /bottom if there is a reversal column been made...only on a 3 box chart
i could have drawn the trendlines/down from that 6870 top made on 22nd may aswell
i think that is what you mean
 
so here is the downtrend from that 6870 top
we also have trend res on this chart
showing at 6578 area
the trendline on the 11 by 3 with res at 6560 area is mainly to see the reaction around that possible res area and to see if it really is going to be a resistance
here is the chart showing the res from 6870 top

f44lr7.gif
 
Top