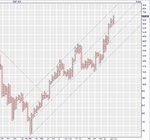
Best Thread learning to read price action with p/f charts

so there we have a few methods of picking up supp/res
1.from the previous main trend..trendlines and new trends just formed
2.45 deg trendlines from the latest column on a 3 box reversal chart.i do use them on 1 and 2 box reversal...just to get an idea of what is happening.from a possible reversal area
3 counts
4.horizontal supp/res
5.fibs
6 ma "s
etc etc
 
notice on the ftse thread
on the dow chart i posted
i had to go down to 60 min data to get that reversal column so as i could plot that 45 deg trend res
it did not show up on the daily.too bullish
remember ..it is on the latest column.which must have a reversal coulumn..min 1 box filled.to see where res/supp and a possible trend reversalarea.also only on a 3 box chart

Yep, I'm following you. Thanks mate
 
so..if we have a column of "X" that has reversed into a column of "O" on 1,2 and 3 box
on each ,we can draw 45 degree trendlines
that gives us areas of potential res if the turn downwards recoils
but the 3 box is the most important
we can then go to 1 box to see if that down move has printed a second spot so we can then draw a subjective trendline
combine that with trendlines on the main trends.then we have a great feel of where the action is taking place
its all in the book
nowt much new from me.except that the 45 deg lines should be placed on all 1,2 and 3 box reversals when there is a column change and should be called pivot areas as when there is a column change,then it usually is a slightly turbulent area and a wider area than a trend continuation area...imho
 
Last edited:
so...as an example
30 year bills.the red trendline was placed as soon as there was a reversal column of 1 box.then line is drawn.the reversal has now filled 5 boxes.but we had a mark as soon as that reversal column printed
bhyx7b.gif
 
same box size
but
1 reversal
we have a 45 deg line
but notice there is another semi-catapult brewing downwards.if that breaks then we can add a subjective trendline.the potentail for two consecutive bearish signals.the fed could be happy with that.dont think they want higher yields.imho
5mwzly.gif
 
the aim is to test the price action when there is a column change,only if it prints a 1 box column change on a 3 box reversal chart.we will then end up with test areas where we can judge whether the reaction is trend continuation or there is an actual reversal taking place.these are the pivot areas
you can place all the reversal trades from these pivot areas with a pretty tight stop,if you do your homework well
 
now we have a fix on where res can be on nasdaq 100..that is trend res not horizontal res
H4 data
16 by 3 hilo plot
3070 area

2gt89w1.gif
 
If sharescope did targets. I bet I know where they might point to..back to updata for me. Sharescope's awful
 

Attachments

  • S&P.JPG
    S&P.JPG
    260.1 KB · Views: 211
agree
i downloaded sharescope demo after you told us about it
spent one hour with it and gave up
there was just too much on it.all i wanted was streamed p/f charts
i am sure it is great.too complex for me
 
agree
i downloaded sharescope demo after you told us about it
spent one hour with it and gave up
there was just too much on it.all i wanted was streamed p/f charts
i am sure it is great.too complex for me

you can count the number of programs that truly square the chart on one hand. Sharescope is one of those, then they go and spoil it. Really not intuitive, click on the wrong thing and you have changed everything. you have to create templates for everything, change it and you are doomed.
worst of all, they seem to "package" their old history. so you might think you are getting 30 days of intraday data then they condense it. You have to view as a candle chart first, THEN do P&F. All my charts would change day after day! Crazy

I would go with market analyst to be honest, one of the best ones I've tried but updata has targets and I really miss them.

yeah...but u gotta keep practising without the targets on.so as you can pinpoint them
then click them on
check to see if you were right
sharescope...i thought was a difficult learning experience and i could not be bothered putting the time and effort to learn
gotta keep it all simple
 
dxy..dollar index
plot that down trend that started on july 10th
will it recoil
res is red lines
or do we break downwards
2rqbuhj.gif
 
Dentist can you recommend a good book re p/f charts to get me started. ive monitored your charts on ftse overtime and it has made me very interested in learning the art.
 
The Definitive Guide to Point and Figure [Hardback]

A Comprehensive Guide to the Theory and Practical Use of the Point and Figure Charting Method
by Jeremy du Plessis

£40
any good

cheers
 
update to our gold trade
with such a clear cut trend .you can put on some fibs..if you want
2nlxuac.gif
 
Top