Best Thread learning to read price action with p/f charts

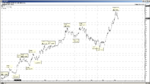
EURUSD ...could go either way
trend supp at 1.2800 area/green
trend res at 1.3300 area/red
we need to test these areas to see where the bulls or bears are
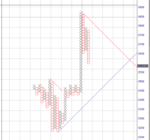
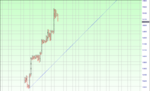
50 pips by 3 reversal
daily close plot
9pome9.gif
 
eurusd possibly a change of trend
there is a possible 3 box count /upwards forming.purple area
so this makes 1.2900 an area of bigger res
1.2834 trendline supp/green
H1 data
10pips by 3 reversal
lets see what happens when bernanke speaks tomorrow
2gtublv.gif
 
cable...H2 data
2 phases of the downtrend that started from 1.5600 area
second phase is being tested
lets seen what happens
feox0i.gif
 
Dentist, lloyds hourly line chart.
P&F on any setting doesn't warn us of any sell off just yet
 

Attachments

  • lloyds.PNG
    lloyds.PNG
    109.7 KB · Views: 192
Hey Dentist, I need a favour
can you provide a FTSE 5 minute chart 5x3 close?
Changing from updata to Sharescope and the two are completely different.
if you could mark where your bullish support starts from, should be 18/19 April
thanks
 
ok you got it
but....
5 by 3...the chart is too long
so had to do a bigger box size
there is a spike on 22 may...that must be the problem
data is from london capital..ftse 100 cash
why the change to sharescope ??
2u9oo0i.gif
 
this is very disconcerting
here's what I get..5 minute 14x3 close so same setting now as yours
I have columns missing, suggesting sharescope cant plot properly or there is data missing
reason for moving was I only need delayed intraday, and updata doesnt provide todays intraday data, and all other packages cant square the chart properly. and really dislike the new version of bullseye. wanted to give sharescope a go..having issues now with things like this..how am I supposed to take a trade without even knowing if the chart is reliable?!
 

Attachments

  • ftse.PNG
    ftse.PNG
    39 KB · Views: 143
My data is from 24 hour feed
LCG via mt4.so there will be pre and post market data
However,for US I use the index and not futures for main analysis.alot of noise is taken out
Did not know that share scope did intraday pandf
 
Just looked at sharescope gold
That is not a bad deal
But as you say there data and of plot could be suspect
Best is.....post a chart of cable
15 min data
.0007 by 1.close
So 7 pips by 1 reversal
Say 2weeks data
Then we can compare
 
Just looked at sharescope gold
That is not a bad deal
But as you say there data and of plot could be suspect
Best is.....post a chart of cable
15 min data
.0007 by 1.close
So 7 pips by 1 reversal
Say 2weeks data
Then we can compare

Need something other than forex, crazy it doesn't accept less than 0.001..good job I dont trade forex..lets try another
how about dow, hourly? 25x3 close..that any good?
 

Attachments

  • dow.PNG
    dow.PNG
    51.5 KB · Views: 146

very worrying. the structure is not too dissimilar, but support in yours is almost at 14500 ish. Support on mine doesn't kick in until 14000.
I shall be on to them on Monday, that will have been the quickest trial I've ever had!
 
very worrying. the structure is not too dissimilar, but support in yours is almost at 14500 ish. Support on mine doesn't kick in until 14000.
I shall be on to them on Monday, that will have been the quickest trial I've ever had!

OK, I've now found the culprits..sharescope was packaging its data, and combined with updata fat finger spikes I was getting all my charts thrown out of proportion.
what a pullava (n)
 
here is 25 by 3 close
H1 data from lcg
it is 24 hour data.an algo of the ym contract
aoulhw.gif
 
New type of reading the chart, was not really knowing regarding this method of reading the charts thanks for explaining it here.
 
Top