Best Thread learning to read price action with p/f charts

final update to our gold trade
a new entry at the aqua line after that big recoil
pole formed..so got out near the bottom
fmp4z5.gif
 
the gold chart from my Samsung phone app
no real need for pf chart
 

Attachments

  • Screenshot_2013-07-26-21-21-45.png
    Screenshot_2013-07-26-21-21-45.png
    42 KB · Views: 169
a look at the actual trading setups for last friday
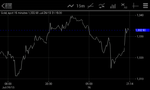
spot gold
the lower box size which i was taking the signals from was .70 by 1 reversal hilo..the $1.00 ,the higher box size posted previously was the roadmap
remember...that can change according to the volatility so that may not look too good next week
entries were taken at break of yellow line
yes..i hear you say that i could have scalped a bit more out of it....but
bearing in mind this was a friday and i also was on to dow,euro ,ftse and dax trades..i had enough on my plate
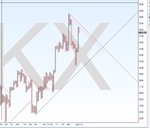
exits were easy to judge...for me
a low pole that hit 1322 area..expected a recoil in this area...so as soon as the column changed direction to "x" s
the low pole after the down move to 1314 area ..as soon as that turned up
then a reentry long in that same area/pivot
no need for masses of tick data/1 min etc

2guhx8p.gif
 
Dentist
Brand new to P@F (just ordered book). Could you look at $ftse on 3 box reversal 15 point box is that a bullish signal reversed. Apologies have not worked out how to uplift charts.

cheers
 
Dentist
Brand new to P@F (just ordered book). Could you look at $ftse on 3 box reversal 15 point box is that a bullish signal reversed. Apologies have not worked out how to uplift charts.

cheers

bull and bear signals reversed are rare.they are usually a correctipn from overbought .or oversold
take a screenshot of the chart
when posting...go to advanced
then attach the screen shot by clicking the paperclip
need to see your chart
 
Dentist
Brand new to P@F (just ordered book). Could you look at $ftse on 3 box reversal 15 point box is that a bullish signal reversed. Apologies have not worked out how to uplift charts.

cheers

what timeframe Jeffre?
 
timeframe would be daily. sorry new at this and still trying to work out how to attach graph I have joined stockcharts awaiting confirmation don't know if that will make it easier
 

if you look at the close chart, you see price coming off internal resistance, so there was always going to be a struggle off your high low if that makes sense
15 box off a daily chart is not really the best setting, but I guess it depends what you want to see/or not as the case may be with P&F.
I generally use 10-15 off intraday charts not off daily. I prefer to hide as much of the noise as possible off the daily charts, and leave intraday for all the detail
 

Attachments

  • ftse.JPG
    ftse.JPG
    95.1 KB · Views: 142
this is probably what you want to see
the trend
where did it start from ?
how many boxes
looks overextended from this chart
could retrace
put some trend lines on
put some fibs on...possibly...50% retrace on that pole
on that trend only
now you have the breakout point...above if it goes upwards
and then also you have the retrace points...tendlines and fibs
then we can see the reaction in those areas
if it goes up..then look at horizontal res from further back or even a fib extension
if it goes down then you have the retrace areas
got it @????
box size is 32 by 2 reversal...close plot
 

Attachments

  • weekly trends053.gif
    weekly trends053.gif
    117.3 KB · Views: 154
Cheers
I am learning by the minute (I think)
see that last column.....that was a rising column of X"s
so....that is an uptrend
we want to visually optimise the chart by changing box size and reversal to expose that latest trend
then....we can place trendlines and fibs for that trend only
if you cannot see a trend...then it is in a consolidation...then refer to congestion analysis in the book
from all that info...you willbe able to pinpoint where you are going to put trades on
 
jeff
same data
with a different construction method
ie hilo plot
the chart is wider
but notice that last upward column of "X"s it has a few more column changes
then we cann draw 45 deg trendlines from these that will give us more info on the trend
however we need to know at what price these lines occur...something you cannot really plot on stock charts
you need to read the book
 

Attachments

  • weekly trends054.gif
    weekly trends054.gif
    71.9 KB · Views: 165
RBS 30min chart
looking like a breakdown about to happen, with the 3box reversal showing potential support around 300, targets at 264 however
 

Attachments

  • RBS 2x1.gif
    RBS 2x1.gif
    54.1 KB · Views: 230
  • RBS 2x3.gif
    RBS 2x3.gif
    63.7 KB · Views: 231
spot gold 15 min...since sunday night open
we got a good signal to go long
a break of trend and a quad top
$1 by 1 reversal/close
voa3cm.gif
 
Top