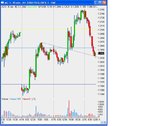
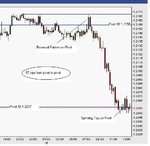
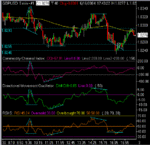
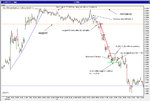
Price and volume here TS 😀 Sorry that's not very helpful! Horizontal support and resistance simply as seen on the chart, price action around obvious decision points, trying to anticipate stop gunning and other nasty tricks by reading the tape, formation and relationship of individual bars etc.
Also Fibs, pivots, 5/3 wave patterns esp. Wolfewaves, measured moves, all the usual patterns (trendlines, flags, boxes, wedges, H&S, V bottoms, V bottoms with platform, cup and handle, Adam and Eve, 1-2-3 etc. you know them all), some candlestick patterns, parabolic moves, 50/200 MA on daily and hourly, round numbers, gaps, adaptive on balance semi-directional doesn't move much and really quite average indicator...ooops I lie, how did that get in there... 😛 Sorry, no offence TS you seem to make RSI really work for you - nice one - but I bet if you took it away you'd find you'd been reading the price action right all along! 😎
I haven't got a real time CME feed so I've resorted to the basic IB charts, with a delayed feed for all the slightly squiggly lines, Fibs etc, which has forced me to consider pure price action with more vigour. Admittedly I couldn't suss it at all on ES but something must have rubbed off cause I'm finding the Euro manageable. Also a mechanical breakout entry in the morning between 7 and 8 has recently worked a treat but after four potential winners in a row I'm going to wait until it racks up a few losers (meaning I'll proabably miss a 300 pip explosion tomorrow . 😕 )
Too right about all those pips...nearly 200 on the table today courtesy of the Euro while ES struggles in a 4 point range. No wonder a lot of people prefer this side of the stadium.
Welcome aboard anmolway I think u may find Forex a breath of fresh air.
Edit: Although we should bear in mind that volatility on indices (VIX etc.) has been low for a few months and is likely to increase in the future. I wonder if there is a volatility indicator for currencies? I'd best have a look...


