You are using an out of date browser. It may not display this or other websites correctly.
You should upgrade or use an alternative browser.
You should upgrade or use an alternative browser.
natureboy
Established member
- Messages
- 770
- Likes
- 2
these patterns happen all the time. Maybe for some, they wouldn't want to skip trades. I feel a little more cautious than i used to. it can be so easy to lose money, and i'd rather lose opportunity. there's always another trade....
that said i'm about to start shorting again.
that said i'm about to start shorting again.
natureboy
Established member
- Messages
- 770
- Likes
- 2
So, that 4am time target 335-400 window, coincided with the high pivot... so far.. Time is tough with market analysis. i have yet to find a time based method that works as well as a price based method. Though my friend is working on one. Price makes sense, time is just sort of there, or even ignored, for most traders.
--
Stop Loss at 1.2915 for any shorts.. volatility to the upside!
--
Stop Loss at 1.2915 for any shorts.. volatility to the upside!
natureboy
Established member
- Messages
- 770
- Likes
- 2
countertrend on the 5m, that GBPCHF. At a Daily upper Trendline resistance. Could be just before a Flag breakout on daily, or could drop again. I'm selling short based on momentum with trailing exit.
I really need to implement a 25% open profit lost stop out rule. i tend to have lower efficiency, working on that.
I really need to implement a 25% open profit lost stop out rule. i tend to have lower efficiency, working on that.
natureboy
Established member
- Messages
- 770
- Likes
- 2
1.5222 Stop Loss, Bear Trend determination level. Below that i'm shorting. I'm using a tighter trailing exit this time, on 2m, which can work also. Volatility recently has been good, but not as good as it used to be. I need to use slightly more aggressive trailing exits.
I do have a max target also for GBPCHF of 1.5190, so this isn't a big pip trade.
I do have a max target also for GBPCHF of 1.5190, so this isn't a big pip trade.
natureboy
Established member
- Messages
- 770
- Likes
- 2
I scale in using small % of account, overall position somewhat larger % of acct at risk, aim to keep under 2% risked per trade setup, ideally closer to 1%. Getting in earlier once pattern first plots and confirms on a smaller timeframe/tick chart is better than finding the setup late like i did here.
530 BoE Fisher speaks. Its like deja vu all over again (YB).. I'll need to exit prior to that.
530 BoE Fisher speaks. Its like deja vu all over again (YB).. I'll need to exit prior to that.
natureboy
Established member
- Messages
- 770
- Likes
- 2
natureboy
Established member
- Messages
- 770
- Likes
- 2
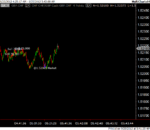
Here is a 13 Tick chart of the USDCAD, entry to stop loss for a short could be <10 pips, giving possibly 50 pips downside, giving 5:1 reward to risk or better.

of course, the trade may not work out! Use your own judgement. For my money, its worth selling if price starts breaking down. USD is becoming more overbought basis the strength meter i use, and CAD is showing support. USDCAD is not yet a short trade setup based on the meter.. which lags, of course.

of course, the trade may not work out! Use your own judgement. For my money, its worth selling if price starts breaking down. USD is becoming more overbought basis the strength meter i use, and CAD is showing support. USDCAD is not yet a short trade setup based on the meter.. which lags, of course.
natureboy
Established member
- Messages
- 770
- Likes
- 2
There are so many ways these patterns can be used. I'm eager to see some quants bring the statistics - time series study goes beyond just prices.
USDCAD looks 'toppy'.. Of course it does to me! And that's the benefit of Objective Patterns - fully drawn by price, plotted by rules via computer - the W5 is there, i don't have to wonder. The trade still may fail, sure, but out of 1,000s of trades i know how to make money with them. And anyone reading this can learn the same thing (in their own way).
USDCAD looks 'toppy'.. Of course it does to me! And that's the benefit of Objective Patterns - fully drawn by price, plotted by rules via computer - the W5 is there, i don't have to wonder. The trade still may fail, sure, but out of 1,000s of trades i know how to make money with them. And anyone reading this can learn the same thing (in their own way).
Similar threads
- Replies
- 35
- Views
- 10K
- Replies
- 75
- Views
- 18K


