You are using an out of date browser. It may not display this or other websites correctly.
You should upgrade or use an alternative browser.
You should upgrade or use an alternative browser.
natureboy
Established member
- Messages
- 770
- Likes
- 2
Scratch that. USD buying may be enough, one line is showing increasing ROC. Getting short EURUSD for last trade of my day.
Good trade setup early in the day, my overall working of it leaves something to be desired no doubt. Win some, lose some - keep fighting. Mostly against your own weakness - never the market. You have to work with the probabilistic nature of the thing. I don't know what's going to happen next or when the market will reverse. .. all that said, i'm getting sick of leaving so much on the table. I need to lock in more profit - so, i'll effort that.
Good trade setup early in the day, my overall working of it leaves something to be desired no doubt. Win some, lose some - keep fighting. Mostly against your own weakness - never the market. You have to work with the probabilistic nature of the thing. I don't know what's going to happen next or when the market will reverse. .. all that said, i'm getting sick of leaving so much on the table. I need to lock in more profit - so, i'll effort that.
natureboy
Established member
- Messages
- 770
- Likes
- 2
i'm still looking for a typical daily range in EURUSD down to around 1.2800 this would be very near the 2.618 external retracement A-D of the W5 (which is often hit in a trend) 1.2815 would be more conservative
next time target is 1120..
next time target is 1120..
Last edited:
natureboy
Established member
- Messages
- 770
- Likes
- 2
These Patterns are Indicators - we can provide call functions that allow users to call the prices of the different points of the chart pattern. So you can build custom studies with these tools in EasyLanguage or PowerLanguage.
I need to expand to Ninja. Any other platforms/languages commonly used?
Maybe I should separate my trading from these indicators. That might be good. People might get the wrong idea! My aim was to show how you can skew reward to risk (the USDCAD trade), which can enable profitable strategy even with 50% accuracy or less (in theory), that the patterns exist objectively (they plot live - see my website), and to show how they can increase defined opportunity. I wrote initially to increase avg trade net profit - that is really hard to demonstrate without backtest results. ..I thought live trading may be the better way to go. Can't fake that. 🙂
natureboy
Established member
- Messages
- 770
- Likes
- 2
...of course people may look at one week's trading and miss the Big Picture. I have videos on my site -these patterns were in the Industrial Index back in the 1920s The Patterns are simply a natural phenomenon, and have great utility in proper context and in a good trader's hands.
NVP
Guest Author
- Messages
- 37,966
- Likes
- 2,158
1.2871 Bear Trend ID.
Definitely should've been 2892 NVP on that long earlier. That was a good price, thanks for that
it didnt hit on my platform so I would have lost out if I had been trading the E/U
gotta scoot.....bye !
N
Attachments
natureboy
Established member
- Messages
- 770
- Likes
- 2
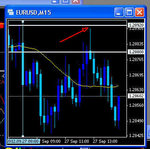
Short, yep. I missed it with my own method today guys. Clarify - I traded the way i was supposed to based on my daytrading system (which is too simple) and i get a + for that. No money, though. The clearest setup was what Gann called, the first reaction to the trend - safest place to enter. Right when average Joe (read natureboy) is thinking go long and emotions are screaming to go one way ... often the exact opposite is the path to profit.
Looking at EURUSD, the trend Leg 1 was 220 -600. The correction ended at 940 area, and that was the place to look to enter. I was focused on following my daytrading system, which I know by doing that i'll make money.
My point in this thread is primarily to showcase the use of the indicators, not my personal trading. So i get a minus minus for that today. The way price behaved, it gave a clear W5 correction, and now we're in the final leg down, Leg 2.
natureboy
Established member
- Messages
- 770
- Likes
- 2
Be back tomorrow. I'm coming prepared, reviewing my system tonight and my errors so far this week. Natureboy net profit on day - down 1.2% How much was possible with pattern trading? I don't want to talk about it.. not right now..
Be back in the manana. Check out the website - I know there are some smart people on here, these Pattern Tools can be a good choice for an addition to your tool box!
Patterns & Forms | Objective Pattern Analysis – Chart Pattern Recognition Indicators – Pattern Trading
Be back in the manana. Check out the website - I know there are some smart people on here, these Pattern Tools can be a good choice for an addition to your tool box!
Patterns & Forms | Objective Pattern Analysis – Chart Pattern Recognition Indicators – Pattern Trading
natureboy
Established member
- Messages
- 770
- Likes
- 2
it didnt hit on my platform so I would have lost out if I had been trading the E/U
gotta scoot.....bye !
N
Yeah, it was actually tagged on IB's feed. Was the absolute high, probably wouldn't have been filled there.

natureboy
Established member
- Messages
- 770
- Likes
- 2
SO - Today's price action was very exciting! I've been looking for a retracement low from the 7/24 - 9/16 Bull Move in EURUSD - more specifically from 9/5-9/16
The 4hr M12 pattern has a breakout trendline, drawn from point A to C which today was broken, and will possibly be closed above.
This portends higher prices to come (in my mind, from my testing). Detailed stats would be preferred, I have seen enough examples for me to believe the larger trend is now shifted up.
natureboy
Established member
- Messages
- 770
- Likes
- 2
Now breakouts like this happen on every timeframe, a recent example from AUDUSD. Pay attention to the initial poke above the TL, then retracing that happens for 3 bars prior to the trend kicking off in earnest.

The EURUSD has definitely tipped its hand, with upside targets as at least 1.3175, possibly higher.
I'm glad a trend is likely back.. i prefer let my method loose on a nice trending market. I'll need to work on my EXITS for the other 70% of the time when i still trade - most definitely.
Peace & Profits
natureboy
Established member
- Messages
- 770
- Likes
- 2
Back on the EURUSD
How much retracement will happen.. Who knows?
Right now the rate is at a possible support trendline, i've got long entries on unless this support line broken.
Also this could be a good time to Introduce ABCD on this thread. The ABCD is more common than the M&W and in a good uptrend can identify more pivot lows. Here is the EURUSD right now:

Not every D point low catches a pivot, many do. The pattern raises my confidence in this TL support holding. We'll see what happens
How much retracement will happen.. Who knows?
Right now the rate is at a possible support trendline, i've got long entries on unless this support line broken.
Also this could be a good time to Introduce ABCD on this thread. The ABCD is more common than the M&W and in a good uptrend can identify more pivot lows. Here is the EURUSD right now:
Not every D point low catches a pivot, many do. The pattern raises my confidence in this TL support holding. We'll see what happens
Last edited:
natureboy
Established member
- Messages
- 770
- Likes
- 2
15m currency strength is against a long entry right now. Projecting the strength lines forward assuming smooth movement, EUR would be in a position to rise near the beginning of European Session. Of course, sharp price movement now will change the strength meter's appearance later
Similar threads
- Replies
- 35
- Views
- 10K
- Replies
- 75
- Views
- 19K