Have you ventured to the dark side yet?

update
 

Attachments

  • Update 6.30pm.JPG
    Update 6.30pm.JPG
    132.4 KB · Views: 186
Above chart, My resistance line now appears to be a support line, no clear trade at this support yet.
I'd expect prices would maybe continue north to around 1.3649/50 area before reversing.
Those that like a bit of risk could go short if prices stall at this point as was shown in previous charts. However,its much harder to set stops when doing this.

Nathan
 
15 pips in 2 minutes, buying pressures definitely winning at the moment,surely they must reverse soon

Nathan
 
Sorry, as I wrote that last post they were already falling. Things are far too jumpy for me to trade at the moment.

Nathan
 
Really appreciate your efforts here, Nathan, especially since this style of trading obviously doesn't lend itself well to real-time posts!
 
Thanks Roberto, It's hard to post real time when the trade lasts less than a minute.
The annoying thing with the last 30 mins is i predicted the directions of prices but had no way of trading them. Doing so would require balls of steal with regards to stop loss points as they couldn't really be defined. I'll stick to support and resistance trading as for me this is the safest method of trading as it has the tightest stops. Hopefully people are starting to see how to filter trades at S&R by waiting for a pause in prices, it can improve your win percentage a great deal.

Nathan
 
20 pips up and 20 pips down within 15-20 minutes, no buying or selling pressure at the moment, perhaps a period of consolidation is now due.

Nathan
 
No trades for me at the moment, I am preparing for some sort of support formation to occur when this consolidation period ends.

For those of you that like risk, take a trade long on the breakout of the current consolidation. 1.3649 would seem an appropriate buy point. Stop loss at 1.3641. Take profits afer 1:1 risk:reward net, which would be 1.3658
 
With the breakout I recommended above you reverse the principles of trading at support/resistance. Ideally prices should accelerate to your entry point and not pause for too long at any one time. If going long prices need to show strong buying pressures. The benefit of trading from 5 second charts is that these pauses in momentum are visually represented on the chart.

Nathan
 
Buying pressure lost momentum at 1.3648 which invalidated the breakout trade at 1.3649.
As I thought 20 minutes ago prices are consolidating, Trading is a no go zone now for me so i'm calling it a day.

Hope T2W members have enjoyed todays trade posts.

Thanks

Nathan
 
Thank you, Thank you, Thank you.

It would have been so easy for you to just do your trades. I had a completely different kind of day and strategy with the EUR/USD. I'd like to know, do you want me to post my comments and charts here or start another thread? This thread is already kind of long, and I'm hoping to see some more of your sub minute stuff. - don't want to detract from or discourage your good work.
JO
 
Excellent work Nathan. Thank you very much indeed for the considerable time and effort that you have shown. This sought of information is invaluable
 
Last edited:
JumpOff,

It would be great to see your trades for today, and to see how you adapt the strategy to suit you.
I'd be honoured to see that my thread has been of practical use and therefore welcome you to post charts on here.
Perhaps a new thread of your own would be helpful showing your work. I'd really appreciate if you could put the link to your thread if made in a post on here as it would be great to see things from a different perspective.

You don't know how happy I am that this has been of benefit to you and hopefully other members. It would be great to see some trading results also in the future.

Thanks to everyone who is following the thread. These positive responses make me want to try and help T2W members even more.

I will keep posting here for as long as there is interest.

Cheers everyone,

Nathan
 
The positive comments inspired me to knock up this little educational tidbit. It could in itself be used as a trading strategy if desired.

Just in case anybody is confused about the two types of entry I use at Support&Resistance reversal points.

Here is an explanatory document showing the differences in entry/exit/stop loss levels.

Strategy A) uses entry actually at the S or R line with a very tight stop, this is best suited to more experienced traders who are confident at picking high probability S/R levels.

Strategy B) Waits for a confirmation of the reversal by entering 1 pip above/below the number 3 point of a 123 low/high respectively. Please note this trade filter : the low of the number 2 point must touch but not exceed the support/resistance line
This is suited more towards a beginner as it filters out a higher percentage of whipsaws and generally speaking when entry is filled prices have a high probability of continuing for a period of time. Money management should be used to determine when you exit the position. Personally I would use no higher than a 1:2 risk:reward ratio. Books always recommend at least a 1:3 ratio, for me this would mean losing far too often.


Anyways here's the chart explaining all this,

Nathan
 

Attachments

  • Reversal.doc
    40 KB · Views: 462
And now for something a little different

But still on the dark side....

The larger picture:
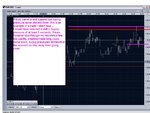
The USD\EUR has been in an uptrend for years. Recently, the market rose 3-400 pips from Dec 15 to the 26th. During the last 4 days it has been in a sideways channel about 100 pips wide.

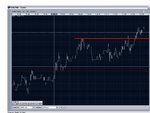
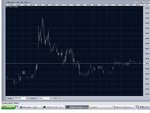
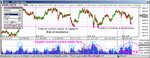
Yesterday and today saw some of the largest supportive volume spikes since Dec 15th - and they happened near the bottom of the channel. So when I sat down to trade, I just waited for the next volume spike in the lower half of the channel and got in. See Chart #1. The volume did not carry the price too far through resistance and the price dropped back into the channel. But the lack of volume at resistance is still the dog that didn't bark. Until we start see the balance of volume change from support to resistance, the price will continue to work it's way up. I had to leave my screen so I put in a stop under the last temporary support, and was stopped out at the pink line. See chart #2.

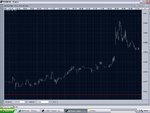
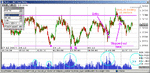
I'm looking to get back in long on the next significant volume surge that turns a downward price action back up - or causes a sideways action to move up. When a price keeps going up, up, up, you have to ask yourself everyday - how long can this go on? Well - a long time. Imagine if you had entered one long position in December of 2002 and just held on (3rd chart). What could you do with an extra 3,600 pips in your pocket? If you look at the third attachment, you can see that there may be another 500 pips up before we hit the return line- if the current long term trend continues.

One of the reasons I am so interested in Nathan's sub minute trading, is that good long term opportunities to enter the EUR/USD safely don't happen along all that often. It often feels like it would be more interesting to watch paint dry. I've been casting about for an activity to keep my interest piqued that has some hope of being something other than a drain on my account. - so far my results from trying my hand at Nathan's sub-minute technique have been too dismal and embarrassing to post. I have yet to be able to distinguish these short term support and resistance patterns in real time.

JO

risk disclaimer: I am a losing paper trader (I have merrily blown through several $10,000 demo accounts). I have only recently begun to break even and see my account balances pull up from the basement. The trades and comments shown below were selected out of many losing trades that in retrospect had no valid reason for entry. This example may simply have been blind dumb luck. (but I don't think so.....)


P.S. I'm long again from 1.3620 at midnight for the reasons stated above - not as much volume as I'd like to see, but a clean entry on a swing low with a tight stop meant not a lot to lose..
 

Attachments

  • 2004_12_30_10am_VolumeAtSupport.gif
    2004_12_30_10am_VolumeAtSupport.gif
    46.4 KB · Views: 246
  • 2004_12_30_10am_VolumeAtSupportLater.gif
    2004_12_30_10am_VolumeAtSupportLater.gif
    45.7 KB · Views: 261
  • 2004_12_30_10am_VolumeAtSupportLater2.gif
    2004_12_30_10am_VolumeAtSupportLater2.gif
    40 KB · Views: 239
Top