Have you ventured to the dark side yet?

sub minute trading

Nathan,
I can see that you have completely studied this whole scenario and have a good grip on realities of scalping with this setup. I wish to confirm my understanding of your stop loss set up.

If the price goes one tick against you, you close. You do not wait to see if it bounces back to zero and then move on in the direction of your trade. In order to complete a successful trade, the price must quickly move away from your entry point in the direction of the trade.

If you enter and and the price hovers for more than 20 - 30 seconds (perhaps moves away at first and then comes back to you), do you wait to close until it moves against you one tick?

Also, you speak of only trading when there is sufficient volume and price action to make it worth your time to do so. And you are trading off a 5 second tick chart. So if it is a good trading enviroment (plenty of price action and volume), there is probably some kind trend action, even if it is only defined on a one minute chart? Are your trades always entered 'with the trend' ?
Thanks,
JO
 
Another question,
I assume when you enter a short time frame trade, you do so with a stop loss automatically in place - that it is not discretionary? Do you also do this with a 'take profit' limit order in place, preset to your desired amount?

Thanks,
JO
 
JumpOff,

The support/resistance points are formed from the 5 second trends, usually within every 2 minutes there will be a trend on the 5 second charts which can possibly form a tradeable entry at support/resistance. I usually trade with the trend of the past 5-10 minutes, eg in an uptrend i enter the position long when prices form support(as long as there is room to take profits between entry and the last swing high). However if an uptrend forms a resistance level that it cannot break on successive swing highs i may enter short. I am most successfull trading in strong 8-12 pip wide rectangles on the 5 sec charts as they give many S&R entry opportunities to make 4 pips profit, rectangles occur throughout the day on 5 second charts if you do plenty of chart watching.
As this is a 5 second chart a 1 pip stop loss represents a large percent of these small trend movements(trends of 7-12 pips usually), so if after entry my support/resistance is breached by 1 pip i will close the position as i was wrong to take the trade at that price, it is therefore important to pick support and resistance points well.
Not being strict when you make a wrong decision may keep you in the trade for an extra 10 seconds against you, these ten seconds can contain a suprising amount of pip movement when they occur at S/R. This is because a breakout is most probably underway and you have an open position in the wrong direction.

Whipsawing can close out a position soon after entry, but this is just an inevitable part of the trading plan. I enter trades with a 4 pip danger stop, I prefer to close my trades manually, but feel comfortable knowing my danger stop keeps my position safe in the event of a system crash. My stop loss levels are always 1 pip and so are not discretionary, a lot of the trading plan is discretionary however, such as choosing S&R, the initial decision to enter the trade here or not, whether to trail stops or not.

I have an automatic take profit level at 8 pips usually but more than often i will close the trade manually before this point.(This 8 pip take profit level can be adjusted upwards mid trade if needed)
When in the trade and in profit if prices start to hover i will usually keep the position open, I entered the trade when my requirements were fulfilled and so should stay in the trade to stick to my trading plan, prices may just pullback to my S/R level again and bounce.

If prices approach my profit target with greater velocity than past moves in the same direction(eg a steeper gradient on this 5 second trend than past recent moves), then i will trail a stop at 3 pips when prices reach 5 pips profit(locking in 1.2 pips profit), stop at 4 pips when prices reach 6 pips profit, 5 when prices reach 7 etc etc. Describing the velocity of the movement in words is hard to do and really needs to be seen and learned first hand.

Hope this answers your questions.

Nathan

Hey JumpOff, just adding a chart for you to show trading with trend at S/R.

Can add an example of rectangle tomorrow as i'm sure one will occur at some point on the 5 second charts. When it does i'll be there ready and waiting.
 

Attachments

  • JumpOffChart.doc
    36.5 KB · Views: 486
Last edited:
Excellent thread Nathan. Thanks for your time and effort. The relative lack of response does not mean nobody is interested, believe me :)
 
Thanks Frugi,

It can get lonely on this thread sometimes, but it helps keep things on topic and i'll keep posting.
Its nice to hear some positive feedback though,

Thanks

Nathan
 
A little off topic,
This is a little excel document i made when messing around which takes your:
Pip loss per trade
Pip Gain per trade
Number of winners per day
Number of losers per day
Required % of account to risk


Input your details into these columns and it should tell you how many $ per pip to place for given account balances. When you reach the next account balance down on the list increase your $per pip by one.
It also tells you how many days, weeks, and total number of pips needed to reach any given account balance given your input parameters.

I'm not 100% sure how successful this little program is so i'd appreciate if you viewers could give it a look and give feedback.

Just made this for a little fun (Is it a bad sign when you find joy creating little excel programs?The word loser springs to mind)

It may be a little tricky to work,seems ok though.


Thanks

Nathan
 

Attachments

  • MM.xls
    238 KB · Views: 377
Ps, the data already included was just used to test it worked.
It is similar however to those used in the successful scenarios above in my post "Sub Minute Trading"
 
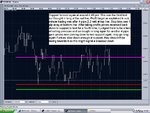
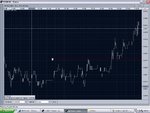
Some recent charts to chew over if you have an interest in the sub minute trading style I explained earlier.

30 second chart gives an overview
5 second chart for entry

Nathan
 

Attachments

  • 30 sec.JPG
    30 sec.JPG
    135.8 KB · Views: 297
  • 5 sec.JPG
    5 sec.JPG
    168.7 KB · Views: 301
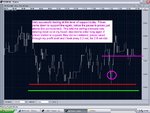
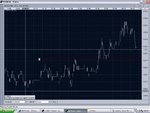
I mentioned in the previous chart that prices might come to test this level of support again, they did, here is a chart update.

Hope these charts are being of use, in this chart I have outlined the pause in prices at support.

Nathan
 

Attachments

  • 5 sec update.JPG
    5 sec update.JPG
    153.3 KB · Views: 287
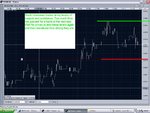
If you're reading this now,there is a 5 second uptrend underway, possible trade could develop soon at support at red line.

Nathan
 

Attachments

  • Possible trade.JPG
    Possible trade.JPG
    129.6 KB · Views: 239
Trade is therefore a buy signal long if prices test 1.3628 before 6.20 pm at the latest for me.
Look for a pause in prices at or near this point before you enter,
Take profit after 4 pips
Stop loss at 1.3627

Happy Trading

Nathan
 
Prices need to come down to support soon before they rise any higher, if they continue higher i will disregard the trade for the time being and wait to see if new support forms at a higher price.

Chart update here
 

Attachments

  • Update 6.02pm.JPG
    Update 6.02pm.JPG
    128.1 KB · Views: 252
Prices finding resistance at 1.3639. Look for a short trade here if it is tested one or two more times,
Long trade still on at 1.3628 if prices fall down to it soon. More likely is a short at this new resistance level.
 
Prices just fell 6 points quickly. Long trade at test of support at 1.3628 looks plausible,
Price now at 1.3631
 
A nice stall in selling at 1.3630 shows me that if prices reach support then the selling pressure isn't too great, which increases the probability of success of a long trade at this point if/when it is reached
 
The scene is a little dull at the moment as we're in no mans land slap bang in the middle of two possible support and resistance points.

Sit on them hands and don't go getting an itchy trigger finger.

Nathan
 
I am leaving the trade at support alone now as too much time has passed. Still enough time for a trade at the resistance level if it is reached soon.

Good luck if you're sticking with this.

Nathan
 
Top