FTSE100- June

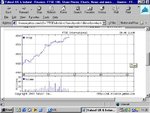
Now I don't want you all to post at once - I know that you are eager to - but we have ftse dropping to the day's low followed by a swift rise and points to be made, so no comments about it being dull.

I was unable to take advantage - no, not gone back to bed like splasher - had to go out and whilst I was gone ftse decided to perform. Who took advantage and if you did not did not ,why not?

A word from our sponsor wouldn't go amiss, mully where are you please.

Regards

bracke
 
Well I bagged 5 points this am - on the way down after the gap closing rise. The futures didn't go as low as the actual index opening gap and in any case I'm still less confident about longs.

Only a tiny position though - still getting over yesterday's loss. It will take a few more days at that rate as well

I've been away for the rest of the day so done nothing else. Don't really expect anything dramatic before the w/e and next Tue/Wed US rate setting. Facinating to watch the FTSE, DOW and S&P500 all moving in sync since @3:00 pm though - like they're all watching the same conductor.
 
peterpr

Give that man a prize - or at leasr 5 points. A few more like that and you will make up on yesterday's loss.

We await dow's final hour for usual sudden change.

Have a pleasant weekend.

Regards

bracke
 
bracke:

Many tnx for ur reply and the link to the website. I shall peruse that and come back with more questions no doubt :)

On many occasions gaps are never closed so potentially u can have a lot of losing trades..yes? no? :confused:
 
Last edited:
FTSE100 review

Not a great week, in terms of overall progress.
Then again it is really just part of the consolidation/corrective process
that global equity markets have been experiencing for the majority of the year so far.

Big question is when will the process be over.

For the bulls out there, look at the US equity markets.

SP500 appeared to break above the declining trendline off its 1163 peak.
However, Friday saw it popped back below. So no clear sign just yet.
But it looks, to me, that it wants to beak out . HOWEVER,

The big event of the year (tabloid terms) will be the Fed decision to raise rates on Tuesday.
Will it be 25bps or 50bps? Money is on the former.
Hopefully all those fearful of rising interest rates will
realise that "measured" rate rises will not be fatal.

As usual analysis of the FTSE100 is being made more difficult by the movements of a few global titans (Vodafone).
 

Attachments

  • table.gif
    table.gif
    14 KB · Views: 174
  • chart.gif
    chart.gif
    14.4 KB · Views: 162
SP500 chart referred to above

Watch the top trendline. Not a successful breakout yet, given Friday's pull back. All eyes on market's reaction to the rate rise on Tuesday.
 

Attachments

  • chart3.gif
    chart3.gif
    27.5 KB · Views: 157
As usual, analysis of the FTSE100 is complicated by the actions of the global titans. On the otherhand, the FTSE250 appears to be in a clear uptrend with rising highs and rising lows.
 

Attachments

  • chart2.gif
    chart2.gif
    25 KB · Views: 148
Like other global equity markets, looking at the bigger picture,
FTSE100 continues to exhibit all the signs of corrective action (ie non implusive).
It is very difficult to see its action as very positive, with the 4511-17 area
currently offering successful resistance.
This area appears to be the 62% retracement of the March-April fall. Is that significant?

However, there is an upward trendline channel in operation from the May low,
as well as the rising trendline off the April low.

So 4511/7 remains the immediate hurdle for bulls,

while a fall through 4460 would break the current trendline channel.


Lets hope Tuesday night and the US Fed allows markets to make up their mind.
 

Attachments

  • chart1.gif
    chart1.gif
    28.1 KB · Views: 184
FTSE 100 Global titan charts

Here are the weekly charts of the 4 biggest UK stocks.

You can make your own minds up about whether they paint a positive or negative basis for looking at the underlying FTSE100 index.
 

Attachments

  • chart.gif
    chart.gif
    18.6 KB · Views: 169
  • chart1.gif
    chart1.gif
    19.5 KB · Views: 168
  • chart2.gif
    chart2.gif
    20.4 KB · Views: 149
  • chart3.gif
    chart3.gif
    20.1 KB · Views: 180
Good morning All,
My take on the FTSE beginnings this week and a chart attached (EOD).
Overhead resistance at 4515 ish kept the lid on market last week.
A go nowhere day on Friday for the FTSE however the US couldn't hold their breakout after European markets closed with the exception of the Nasdaq. Interestingly it led the market earlier last week and is still in a much stronger position than the other indicies.
On an intra chart the FTSE has a gap from the opening on 23/06 it may fill before the interest rate announcement between 4465-4472 and this is also the 50% level of the swing from June 8 high to June 14 low. If it touches there today and bounces it will also keep the upward sloping trend line intact between the June 14 and 22 lows.
Where is it going to go--I don't know.....but if 4460ish can't hold June 14 low of 4430 then previous lows could offer some support.
To the upside 4515-18 Res needs to be overcome then I'm expecting 4555-74 to offer resistance. If it doesn't well then we'll see what happens at 4600....
 

Attachments

  • aftse.gif
    aftse.gif
    24.1 KB · Views: 162
alliance

I would suggest that all gaps are closed eventually, but the time taken will vary according to the type of gap. I think you will understand once you have visited the site I suggested.

Regards

bracke
 
Pivot for Today 4494

R1=4503
R2=4512
R3=4521

S1=4485
S2=4476
S3=4467

The gap down this morning to 4479 held at the S2 level. At the time of posting this it had risen to just under 4500 and had closed the gap.

Regards

bracke
 
Last edited:
mully

I know that you trade what you see but I get the impression that you are leaning towards bullish thoughts rather than bearish ones, am I correct and if so why?

Regards

bracke
 
Morrning Peeps
I would agree with KJH here, there is a lot going on in the US and I would favour an initial bull run for the first half of the week which would take the FTSE to 4550 area before heading back to recent lows over the coming month
 
What a morning....Gap down open, move down, reverse ('outside reversal up' day currently) and didn't even blink at the previous highs.
Large range (55 points as I write-- High currently 4533) day thus far compared to recent weeks.
Largest up day since May 19
Anyone know what stocks are driving it? What the volume is like ?
I notice also E- minis on Globex up strongly and possibly the impetus for this move.
Is it going to be a 1 day wonder ?
KJH
 
Hi KJH,
I don't know but have been jobbing this on the upside all morning and we don't seem to be running out of steam yet. Missed the reversal and initial move due to being out and am kicking myself for not being long of breaking 4510 on futs but went long at 4520 and havce been in and out several times since, onl;y taking 3-5 ticks eacxh time as i'm pretty nervous of another reversal. Indicators all look OK thgough.
My levels currently are targetting 4582.5 then 4600 for sep with support now at around 4530 and 4500.

Longer term than about 10 minutes i haven't got a clue i'm afraid!

Is this just a kneejerk to handover and will reverse or the start of a new move higher?
 
You know 4535 could also end this move--for today at least...
See attache EOD Chart.
Gann people should love this--I hope...
4435 is 1/8th extension of the range from may 17 low to June 8 high.
It is also 100% range expansion of june 22 low-june 24 high projected from todays low of 4478
I know, if you crunch enough numbers you come up with a price for every level but it might be worth looking at. ( same with gann time counts in my experience)
My RSI has divergence....5min intra day chart......and the intra day sma is almot caught up...
may be time for some testing of the daily move up now ?
I have a rule where the faster a market goes up the faster it usually come down
( fast moves are usually false moves.....)
KJH
 

Attachments

  • aftse.gif
    aftse.gif
    19 KB · Views: 207
I find it a liitle odd that such a significant rise is on insignificant volume,

In the chart below there are 3 volume spikes but they are not accompanied by large changes in price. The rise appears to be driven by low volume which begs the question is this going to hold.

Can we have the benefit comments of the experieced members of this thread please.


Regards

bracke
 

Attachments

  • untitled.jpg
    untitled.jpg
    65.4 KB · Views: 186
splasher said:
Is this just a kneejerk to handover and will reverse or the start of a new move higher?

Splasher,
Thanks for your thoughts.
Yes, I didn't believe what I saw when the run started but got long at 4515--stopped out at 35
(Futs) earlier
Now flat....
I Suspect well drift now till the US opens and either jumps from the action on Globex or the profit takers come in.
Presently (11.55 gmt) the Us is still short of their recent highs on Globex
Who know---other than there is a lot of built up pressure there for a break one way or another.....
Bit like forcing someone moggy into a box, shaking it sideways for a couple of weeks then lifting a corner for a peek in to see if it is still in there......! You all can imagine what happens.....
KJH
 
Top