You are using an out of date browser. It may not display this or other websites correctly.
You should upgrade or use an alternative browser.
You should upgrade or use an alternative browser.
Hi Barjon,
I define the trend with 3 moving averages - 100ema, 32ema and 10sma.
Use to trade with 1 min chart but found the 5 min chart more reliable and keeps you big moves for longer
I look at the relationship between distance of price from the moving averages and the difference in slope of the moving averages.
I have found the corrective waves cause the 10 and 32 day averages to crossover and converge close to the 100, before moving in back in the original direction.
FetteredChinos
Veteren member
- Messages
- 3,897
- Likes
- 40
morning all, have been doing some research into indicators (dont strike me down please lol)
i dont normally use them, but this one has caught my eye.
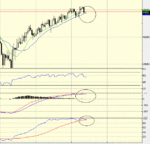
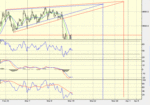
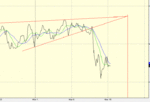
seems like buying/selling a break of the Parabolic SAR can yield decent gains during volatile moments..eg the opening scramble, and the period running up to the close...(not sure of an exit point, perhaps a fixed target could be in order??? - more analysis required)
just another string to the bow perhaps.
FC
Attachments
Similar threads
- Replies
- 5
- Views
- 49K


