You are using an out of date browser. It may not display this or other websites correctly.
You should upgrade or use an alternative browser.
You should upgrade or use an alternative browser.
jonny....all the books I have read talk about "the psychology" problems of trading etc but none of them really tell you how to over come it/them? If you know the problems think its just something you have to work through and the better the trading method gets the more confidence you get and so on and so on.
jonnyy40
Experienced member
- Messages
- 1,329
- Likes
- 11
Do you have to be registered/keep tapes of consultations to become a Hypnotherapist?I think I'll set up as one specialising in trader's problems,then 'suggest that the better ones tell me their strategies or place 10% of their winnings in a Swiss bank account for me.
barjon
Legendary member
- Messages
- 10,752
- Likes
- 1,863
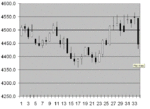
interesting idea - a bit similar to the "melded" candles technique
to help clarify things.
not so sure about removing the previous candle after an outside
day - engulfing candles are usually pretty significant so wouldn't
want to blur their impact at all.
to help clarify things.
not so sure about removing the previous candle after an outside
day - engulfing candles are usually pretty significant so wouldn't
want to blur their impact at all.
the previous day wouldnt be as important as a new low and new high would have been made? ??? but if you are using the patterns then you couldn't remove any of them really. I was thinking more along the line of a smoothed trend and support resistance areas. Guess you could use a bar chart instead.
barjon
Legendary member
- Messages
- 10,752
- Likes
- 1,863
mmm, certainly helps present a smoother picture (and points up
the eod support provided by the base of that long white!!).
Wonder what tomorrow holds? I know the chat on the boards
was already shortish (didn't you go short the Wednesday
evening just before the close?) but I still felt pretty uncomfortable
making money from other peoples misery. It might have gone
down anyway, but the Madrid tragedy must have triggered most
of it.
barjon
Legendary member
- Messages
- 10,752
- Likes
- 1,863
Similar threads
- Replies
- 5
- Views
- 49K


