You are using an out of date browser. It may not display this or other websites correctly.
You should upgrade or use an alternative browser.
You should upgrade or use an alternative browser.
hungrybear
Active member
- Messages
- 209
- Likes
- 0
bonsai - do you do any trading direct on the futures market?
hungrybear
Active member
- Messages
- 209
- Likes
- 0
Bonsai, I thought gaps were only at the open and as the ftse went down before rising, where's the gap - unless you're talking about gaps from a few days ago, which will probably get filled later this year, I expect in November.
I have a 2min dot chart.
if I don't get a dot , to me its a gap.
call it structural weakness if youlike.
its proved useful too often to ignore.
it left a gap around 90 on the way up this morning.
and the fact that it coincides with the fib, makes perfect
market sense to me.
ftse likes to fill its gaps.
but you can never be sure of when.
that's the adventure.
hungrybear
Active member
- Messages
- 209
- Likes
- 0
RAOFL bonzai - from my 3 year old.
HB
😆
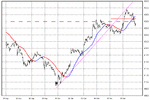
ok, here is a chart which pretty well says it all.
But I am posting it to point out once again the value of
constructing a resistance line.
You always have to give it a little while to confirm the top
but what's a few pennies here and there ?
Perhaps not quite as obvious as some previous charts but
Support turning into Resistance is clear if you know what to look for.
Not only that, but my hourly chart was also pointing to the same
level and the intersection of the two, gave me some interesting pyramiding trades today.
I'll put up the hourly chart in my next post.
Attachments
Similar threads
- Replies
- 12
- Views
- 19K

