FTSE 100 intraday trading - JULY 2003

  • Thread starter Thread starter bonsai
  • Start date Start date
  • Watchers Watchers 6
Morning Bonsai et al

damn all volume again - it's like watching tennis on an outside court until the big guns appear on centre. If we were on our own I could convince myself of some upside, but I think I'll wait til I see how Serena Dow and Venus SandP are serving.

good trading

jon
 
Goring ?
thats a nice part of the world.
used to eat there occasionally.
Danny La Rue's place
The Swan ?
 
Bonsai,

How are you collectings the ticks/trin for the FTSE? Have you got a spreadsheet for this?

Cheers
 
Calypso
I dont have info available.
also dont know of uk software package or data feed that makes
it available.

could be wrong though

not even sure the LSE publish it.
 
Bonsai

My respect for you as a trader has increased ten-fold if you've been making enough to eat at The Swan!! Not Danny's anymore (I wonder if he's still alive and high-kicking) but still The Swan, still a touch expensive and still a great setting.

jon
 
Hi Bonsai,

Well where do you think this puts us in the wave count now?

Is this a continuation of C or have we started a new 5 wave rise. Could the fall from 4219 to 3990's have been only an abc, rather than a 5 wave. All seems very speculative because the waves are not that clear except for a move like 4219 down to 3990's is obviously a wave in itself but breaking it down further I find very difficult and maybe dangerous to follow on it's own. LOL

It amazes me how I often return to read Murphy's book about a specific topic only to find that the info was in there all along and probably overlooked because it was not my main focus at the time. I was going back over the basics of trendline yesterday only to find his reference to always extending the trendline as far to the right on your chart because of the way trendlines revert from support to resistence after a breach. It was there all along, LOL.


Like another one; following a 40 to 60% retracement it is always a good trading opportunity.

Kevin
 
Kevin,

Yeah, that's always the trouble I have with wave counts - I always seem to find it difficult to see the wave except in hindsight when it's usually too late!

One of the joys(?) of ta is that whatever happens you can always find some technique/indicator that would have got it right. Just goes to show you have to find something that suits you and stick with it without obscuring focus by dipping into the bran tub too often.

Good trading

jon
 
the chart looks like a pennant which is bullish and so at least
one more high. But it is shy of fib at 4085 where we might find
some sellers coming back in if the dow doesnt go beyond 9120
after the open ?


edit
PS: But the trade at the mo is short from about 62. To cover the gaps below and because we never know what will happen next.
 
Last edited:
Bonsai

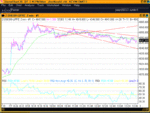
At least it was a gap or spike up today which worked rather well.

Although since 9.25am its been down, and trading between the trendlines forming a short term intraday channel.

Kevin
 

Attachments

  • 1.gif
    1.gif
    55.8 KB · Views: 398
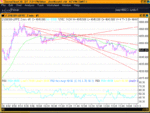
Where next - chart looking a bit like spaghettei junction LOL
 

Attachments

  • 2.gif
    2.gif
    56.6 KB · Views: 407
got up at the crack of dawn and got ready to trade, only to find out that my internet connection was down! it's only just started working again.

if i was superstitious this is definitely not a good sign to start the week on. i hope others have faired better.
 
It would be prudent to ensure that you have at least 2 ways to access the internet. I have broadband and also AOL dialup sitting ready to connect if broadband goes down. It hasnt yet but you simply never know. I did an experiment once where I just pulled out the broadband connection and then timed how long it would be to connect via dial up and be able to close a trade, it was 80 seconds in total to be able to close the trade which was OK but in my view still not good enough.


Paul
 
kevin
if you think you could conservatively get 80 pts today
then you and I are poles apart.
Perhaps I had better be the one to assess how many points can
be achieved on a conservative basis then at least we might have
some consistency ?

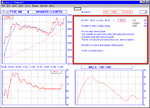
I have made my assessment on my day Chart.

A Goose open this morning so you needed to be looking to trade
above the gap to get in below 50 where there was resistance
from previous gaps. Not an easy decision ?
Especially as the sb's were well ahead of the game. !
 

Attachments

  • jul7.gif
    jul7.gif
    20.4 KB · Views: 292
Last edited:
bonsai
I'm with you. I think claims of 80 points are fantasy, and rely on post rationalisation. US sold off heavily late on Thursday- not a great help to hold an open positive position over the weekend-. It was Japan's strong performance that led to the strong opening. Let's all be reasonable and deal in the real world. The key ingredients for successful trading are Objectivity and Flexibility.
 
Hi Bonsai,

Understand your view but remember we do things a little differently. I was basing mine on the futures market following confirmed trend line breaks or divergence. But I accept you would have to be trading near perfect to get these results. The reason I said conservative was because I rounded down but still feel if you were applying certain criteria which I am then I still feel confident that above 70 was possible, if you had a mind to trade throughout the day.

Kevin

ps you know my system confirmed trendline breaks on 2 min chart and good divergence from extreme RSI. Nothing new there!!
 
Back
Top