You are using an out of date browser. It may not display this or other websites correctly.
You should upgrade or use an alternative browser.
You should upgrade or use an alternative browser.
Lambchops
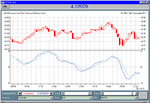
without doing the detailed maths on the subject, the MACD
is a plot of the DIFFERENCE between 2 ma's.
so to speed it up, you need to reduce the difference.
but that may not be enough on its own.
and the peaks and troughs vary from day to day
depending on the market.
so you may have to experiment in a quiet moment
when the market is open but towards the end of the day.
the chart I put up is 5min bars so 13ma is 65minutes
or approx 1 hr which is what I usually apply.
but 26ma is equivalent to about 2 hrs which as far as I can tell
is not especially appropriate to ftse on most days.
have a go and see what you can do with it.
I would be interested in hearing the results if you do trade it.
Sledgehammer
Member
- Messages
- 75
- Likes
- 0
fyi
28 July 2003 07:33:31
Exchange [Liffe] : Exchange message. , Ftse pre-opening call is set as 4145.0
28 July 2003 07:33:31
Exchange [Liffe] : Exchange message. , Ftse pre-opening call is set as 4145.0
Similar threads
- Replies
- 478
- Views
- 70K
- Replies
- 808
- Views
- 102K
- Replies
- 197
- Views
- 33K


