Best Thread Firewalker's Journey: A path of discovery in search for enlightenment

Status
Not open for further replies.
August 24 - Summary

What I did:
3 Trades
L 5775, target 1 @ 5795, target 2 @ 5805 = +50
S 5825, stop @ 5833.50 = -8.5
S 5825, stop @ 5829 = -4

Standings:
* P/L = 50:12.5
* W/L = 1:2
* biggest loss = 8.5pt
* max number of successive losses = 2

What I should have done:
I did exactly what I said to do, so I followed my plan, waited for a setup to occur and then acted on it as planned. Although the result of the day is positive, I feel it more than anything to be luck because the first trade turned out well in a volatile moment.

Things to think about:
- The third trade was a bit of a waste. Consider not entering just because of one bar. Wait for a second bar, so you don't get spiked out or in a trade that catches you going in the wrong direction. Applying this on today's trades, that would mean no second trade and one less losing trade.
 
firewalker99 said:
Although the result of the day is positive, I feel it more than anything to be luck because the first trade turned out well in a volatile moment.

Why luck? You had a setup, you plugged it into a strategy, you traded the strategy, you won. Luck had nothing to do with it.

Things to think about:
- The third trade was a bit of a waste. Consider not entering just because of one bar. Wait for a second bar, so you don't get spiked out or in a trade that catches you going in the wrong direction. Applying this on today's trades, that would mean no second trade and one less losing trade.

You're not including your remarks about the long you didn't take and the short you didn't take. These may form a pattern over time.
 
firewalker99 said:
As with the Three Things, good idea. But as for writing on paper what I felt... I think that would draw me back right where I started, trading on "feelings" and hunches and that costed me dearly. Today I was right perhaps, but I consider it nothing but luck. I know that if I were to trade on those "feelings", things could be over very soon.

I didn't say trade it; I said write it out. Get it out of you and onto paper. Then set it aside. Save it for some future session when you're trying to decide whether you're being intuitive or just rationalizing a failure to maintain discipline.
 
Something to think about:
 

Attachments

  • Image3.gif
    Image3.gif
    87.8 KB · Views: 259
dbphoenix said:
Something to think about:

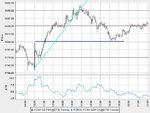
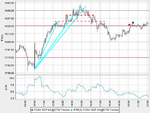
Actually tried drawing one myself. The thing is, I looked at a lot of your charts, and you draw several trendlines. This probably works nicely for you, but sometimes I found it to be confusing. At first you what you would see is a trendbreak. But then later on, another one is drawn which actually denies that fact. At what point do you stop drawing a new line? This chart happens to be a clear upmove, but I've had lots of days where price just doesn't know where to go. In fact, I happened to post some of these charts in the Daily DAX thread as a reply to rols...
 

Attachments

  • 20060824trend.JPG
    20060824trend.JPG
    58.2 KB · Views: 209
August 25: First trade

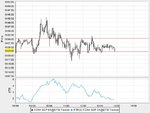
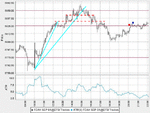
Today, instead of entering at the first tick of the S/R, I'll wait for a second bar to confirm the entry point. After the break above 5825, I looked for price to retrace to 5825.

S 5825 at 1100 with ATR = 4.5 so target at 5834, stop @ 5820.5 hit at 15 minutes later.
 

Attachments

  • dax20060825.jpg
    dax20060825.jpg
    48 KB · Views: 176
S/R confusion

According to the plan, S/R medium term is found at 5825.
But looking at today's and yesterday's chart together, 5821 and 5830 suddenly seem more appriorate. This brings me back to the basic problem: if I don't have "correct" S/R levels which is basically a fundamental brick in the plan, I'll be in trouble.

I will not let this influence any decision however, and continue with the plan and use the predefined S/R levels.
 

Attachments

  • 20060825sr.jpg
    20060825sr.jpg
    48.9 KB · Views: 179
No trend...

Another problem is that primarly a trend is necessary to be able to act out my plan. Going long on BO of R in an uptrend and shorting S in downtrend, is going to be a problem days like these...

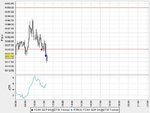
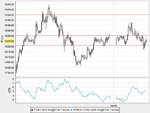
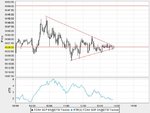
I'm reading LrH's and HrL's so that doesn't make up for a clear direction except for converging towards 5825 (left chart)...

On the other hand, if I'd drawn S/R at 5821 and 5830 as stated in previous post, price is clearly moving sideways (right chart)..
 

Attachments

  • next.jpg
    next.jpg
    52.8 KB · Views: 162
  • range.jpg
    range.jpg
    51.1 KB · Views: 157
firewalker99 said:
Actually tried drawing one myself. The thing is, I looked at a lot of your charts, and you draw several trendlines. This probably works nicely for you, but sometimes I found it to be confusing. At first you what you would see is a trendbreak. But then later on, another one is drawn which actually denies that fact. At what point do you stop drawing a new line? This chart happens to be a clear upmove, but I've had lots of days where price just doesn't know where to go. In fact, I happened to post some of these charts in the Daily DAX thread as a reply to rols...

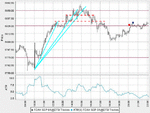
It's confusing to those who have not yet learned how to read charts from left to right, and there are more than a few. Once you read Trendlines 101, it will become clear, but, in the meantime, the trendlines are drawn in real time along the swing points. But after the line is broken and a new high is made, a new TL at a different angle has to be drawn (in the case shown here, all subsequent new highs were made without breaking the line, hence only one TL). The first TL becomes a Stage 1 TL and the second a Stage 2. By the time a Stage 3 TL is drawn, momentum is essentially shot.

You can search the subject with my name or with one of the smartest technicians I know -- The Blind Squirrel -- here on T2W.

Edit: in case you're referring to the chart I posted last night, note that the first TL is drawn shortly after noon. Price then makes three successive higher highs so a new line has to be drawn (in reality, the second line would be drawn just to the left of the one actually drawn, then a third line below the highest high after the highest high is reached). This is how it's done in real time, though previous TLs are usually erased; those who are studying charts in hindsight will generally look only at the lowest low and highest high and skip all the work that would have been done in real time inbetween.

But none of that is why I posted the chart. I was pointing out the additional S/R levels, which I believe if used would have addressed your problems.
 

Attachments

  • Image1.gif
    Image1.gif
    89.6 KB · Views: 208
Last edited:
firewalker99 said:
Today, instead of entering at the first tick of the S/R, I'll wait for a second bar to confirm the entry point.

I don't understand what this means.
 
firewalker99 said:
Another problem is that primarly a trend is necessary to be able to act out my plan. Going long on BO of R in an uptrend and shorting S in downtrend, is going to be a problem days like these...

Then don't trade.

I'm reading LrH's and HrL's so that doesn't make up for a clear direction except for converging towards 5825 (left chart)...

LrHs and HrLs define trendlessness: chop, consolidation, congestion, hinges. If whatever you're doing depends on trend, then wait for one. If you want to incorporate something like hinges later, then do it later after testing it. In the meantime, just watch it, make notes, save them for later.
 
dbphoenix said:
I don't understand what this means.

Instead of placing a limit order on forehand, I will use a limit order after already one bar has completely formed that touched the S/R level. That way I won't be in trouble if the first bar happens to spike and turn around in seconds.
 
firewalker99 said:
Instead of placing a limit order on forehand, I will use a limit order after already one bar has completely formed that touched the S/R level. That way I won't be in trouble if the first bar happens to spike and turn around in seconds.

I guess I'm being thick, but I'll wait for an example later.
 
dbphoenix said:
LrHs and HrLs define trendlessness: chop, consolidation, congestion, hinges. If whatever you're doing depends on trend, then wait for one. If you want to incorporate something like hinges later, then do it later after testing it. In the meantime, just watch it, make notes, save them for later.

Ok, I only put up that chart with two converging lines to illustrate what I say, not to do anything with it...
 
dbphoenix said:
I guess I'm being thick, but I'll wait for an example later.

I think a chart could better illustrate it than me putting it into words. Post #402 is actually an example, the first trade. I didn't want the red dot to cover the third bar, but it means actually that the entry point is at the third bar at 5825 instead of the first bar...
 
dbphoenix said:
It's confusing to those who have not yet learned how to read charts from left to right, and there are more than a few. Once you read Trendlines 101, it will become clear, but, in the meantime, the trendlines are drawn in real time along the swing points. But after the line is broken and a new high is made, a new TL at a different angle has to be drawn (in the case shown here, all subsequent new highs were made without breaking the line, hence only one TL). The first TL becomes a Stage 1 TL and the second a Stage 2. By the time a Stage 3 TL is drawn, momentum is essentially shot.

You can search the subject with my name or with one of the smartest technicians I know -- The Blind Squirrel -- here on T2W.
I'll get back to you on that after the weekend. I won't say anything (probably stupid) before reading and studying it.

dbphoenix said:
But none of that is why I posted the chart. I was pointing out the additional S/R levels, which I believe if used would have addressed your problems.
I think a lot of my problems could be addressed by drawing better S/R levels... which I incidentally pointed out this morning also (5821?-5825?-5830?)
 
firewalker99 said:
I think a lot of my problems could be addressed by drawing better S/R levels... which I incidentally pointed out this morning also (5821?-5825?-5830?)

It's not so much a matter of drawing better ones but of re-assessing them throughout the day. S/R lines are dynamic, not static, which is why I posted the charts in the S/R thread in real time. Every swing point represents potential S/R. Many if not most don't pan out. But you still have to pay attention.

In the chart I attached to the last post, a swing high was made just after 1200, followed by consolidation. This SP represented potential R. The fact that price busted through it so decisively suggests that it would be (1008: well, I'm glad I didn't listen to the devil on my shoulder and not trade today) of at least some importance. Then when price returns to that level and sits there for four bars makes it even more important, a potential "springboard". Ditto on the next spurt upward at 1400.

I don't know how many points each of these spurts represent, so I don't know if they meet your qualifications. But they do seem to represent winning trades, but only if you re-assess S/R as it's created in real time rather than stick religiously to what happened yesterday.
 
Something to think about

dbphoenix said:
Something to think about:

Looking at the newly drawn S/R lines short term, this would have constituted in the following trades:

L @ first S/R (approx. 5832) after retrace that happened after BO to 5844-ish, with ATR 5.5, so target of 5843 was hit without a doubt.

L @ second S/R (approx 5844) after retrace that occured after BO to 5854, but there that wide spread bar with a long wick took me out at (ATR=6) 5838... Now you could say that this was already very late in the uptrend that I decided to go long, more over it was going long after price had hat resistance at 5850 but the TL isn't broken yet.

So after the TL is broken and prices goes lower than the LSL, I see the following:

S @ first S/R after retrace, so exactly at 5844, target of 5830.

S @ seconds S/R, again after nicely retracing at 5832, target of 5817 no problem.
Price only hit this level once however, and I prefer to see more than one more bar hugging the line before entering.

Anyway, indeed these were all nice profitable possibilities.
Are you saying I should focus more on short term S/R that develop throughout the day instead of those drawn on the chart. I know I shouldn't stick to them as if they hold the one and only truth, but it builds more confidence trading on levels that have already proven to be of some support (or resistance) than these kind... Either the case, I'll be trying to analyze where S/R is found during the day in the next week.

dbphoenix said:
In the chart I attached to the last post, a swing high was made just after 1200, followed by consolidation. This SP represented potential R. The fact that price busted through it so decisively suggests that it would be of at least some importance. Then when price returns to that level and sits there for four bars makes it even more important, a potential "springboard". Ditto on the next spurt upward at 1400.
During my "observing" periods when I was looking at charts in realtime, I often found price to move further into the direction of the trend after these consolidation periods. As English is not my mother tongue, I was wondering in what does consolidation and congestion differs? Do you mean that with the latter price is moving but within a limited range, and with a consolidation price is actually slowing down, smaller bars and perhaps less volume?

dbphoenix said:
I don't know how many points each of these spurts represent, so I don't know if they meet your qualifications. But they do seem to represent winning trades, but only if you re-assess S/R as it's created in real time rather than stick religiously to what happened yesterday.

I don't know if you meant the day before with "yesterday" or were suggesting what happened before. I already left yesterday's S/R lines off the chart, to leave only those of intermediate and long-term on it. Indeed those could have been winning trades.
 

Attachments

  • Image1.gif
    Image1.gif
    89.6 KB · Views: 176
Last edited:
dbphoenix said:
This is a remarkable improvement. For the most part, this tells you exactly what to do during the trading day (the "whole day" occurs after the open). However, there are a few areas that will likely cause problems (or caused, if all of this has by now passed.

This is very nearly something that somebody could actually trade.

I was wondering if the setup is (very nearly) clear to others also? I'd like to ask anybody who's following this thread: Would you be able to read the same out of it? Take the same trades at the same time at the same price? Or would you extract something else out of it which perhaps I've overlooked?

Answering this question could confirm the fact whether my setup is clearly defined. Just a thought.
 
August 25: Review of the trades

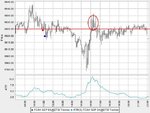
S 5825 at 1100 with ATR = 4.5 so target at 5834, stop @ 5820.5 hit at 15 minutes later.

Although at 1600 we have a BO, I don't trade on news (ic Bernanke) and I don't consider these bars to be a retrace other than touching the previously drawn S/R line at 5825 on almost every occasion.

For the rest of the day price slowly stepped upwards but no further opportunities were spotted.

1 Trade
S 5825, stop hit at 5820.5 = -4.5

Standings:
* P/L = 50:17
* W/L = 1:3
* biggest loss = 8.5pt
* max number of successive losses = 3
 

Attachments

  • 20060825atr.jpg
    20060825atr.jpg
    58.6 KB · Views: 159
Status
Not open for further replies.
Top