Best Thread Firewalker's Journey: A path of discovery in search for enlightenment

Status
Not open for further replies.
August 25: Alternative review

Why not have a look at what "could" have been done, if I used other than the predefined S/R levels. This is not in line with what's defined in the setup or plan, but I will add it to the journal as it might be something to think about if similar signals were too appear.

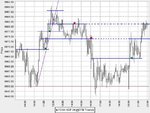
At first there is a BO above 5830 which is where price pushed against before 0900. We wait for price to come back to 5830 which happens a full hour later. At the second bar (the large wick bar) we entered at exactly 5830 with ATR=6, so a stop at 5824, hit another hour later, before the target of 5842 had been reached.

At this point we've alvo seen a downtrend developing, so longs are no longer tolerated. The BO down 5830 whole the way to 5817.50 occurs before price takes it's route back to 5830. At the second bar (exactly 1200) we short (ATR=5), first target of 5820 was hit after which we moved the stop to BE. Unfortunately this means being stopped out before the down move continued. We now have however a second trendline in a less steeper angle.

The next opportunity occurs when price drops below 5820. This never gets to be a trade however as the BO is less then 10 points, and even if it were, price only hit 5820 back once time and we were waiting for a second bar... Perhaps the setup is too strict and too fixed on numbers? On the other hand, twiddling with the numbers feels like adjusting your setup to fit the missing trades.

The last opportunity then. After the BO above 5820 and after a potential SC the downtrend is broken. Price went up all the way from 5795 to above 5830, which I consider a sign of considerable strenght. After it retraces to 5820 we enter at around 1645. ATR = 9, first target = 5838 and stop 5811. The stop wasn't hit, but neither was the target. This is hindsight of course, but I probably would have closed on the position somewhere between around 2100 as price seemed to consolidate on 5825.

So, to summarize, one losing trade, one winning trade (1st target), one near-opportunity and one profitable trade without reaching target.
 

Attachments

  • 20060825.jpg
    20060825.jpg
    68.1 KB · Views: 186
firewalker99 said:
Looking at the newly drawn S/R lines short term, this would have constituted in the following trades:

L @ first S/R (approx. 5832) after retrace that happened after BO to 5844-ish, with ATR 5.5, so target of 5843 was hit without a doubt.

L @ second S/R (approx 5844) after retrace that occured after BO to 5854, but there that wide spread bar with a long wick took me out at (ATR=6) 5838... Now you could say that this was already very late in the uptrend that I decided to go long, more over it was going long after price had hat resistance at 5850 but the TL isn't broken yet.

However, if you're taking two contracts at the first S/R and covering one at ATR1, aren't you still holding the other when price moves on to 5854?

Are you saying I should focus more on short term S/R that develop throughout the day instead of those drawn on the chart.

Focus on whatever S/R provides profit ops. Focusing only on the rear-view mirror makes you lazy. Open up your mind to what's being made available to you. But don't see something that isn't there. This is avoided by being definite about what you're looking for.

During my "observing" periods when I was looking at charts in realtime, I often found price to move further into the direction of the trend after these consolidation periods. As English is not my mother tongue, I was wondering in what does consolidation and congestion differs? Do you mean that with the latter price is moving but within a limited range, and with a consolidation price is actually slowing down, smaller bars and perhaps less volume?

If you asked ten technicians, you'd likely get ten definitions. For me, congestion has no particular purpose. It's like a traffic jam. Consolidation is putting one's ducks in a row in preparation for an intentional move of some sort.

On a practical level, though, it doesn't much matter. You have your S/R levels. Trade them. If the move isn't real, you'll be SO.

I don't know if you meant the day before with "yesterday" or were suggesting what happened before.

Yesterday is whatever is prior to what is being shown.
 
firewalker99 said:
I was wondering if the setup is (very nearly) clear to others also? I'd like to ask anybody who's following this thread: Would you be able to read the same out of it? Take the same trades at the same time at the same price? Or would you extract something else out of it which perhaps I've overlooked?

Answering this question could confirm the fact whether my setup is clearly defined. Just a thought.

For those who don't have access to intraday DAX charts, it will help if you provide a blow-up that will show the number of points in each move, i.e., something that breaks down the square into something more than 12.5 points. As it is, it's next to impossible to know how many points each bar represents. Therefore, it's next to impossible to know whether a given bar meets the criterion for a prerequisite to an entry.
 
firewalker99 said:
Why not have a look at what "could" have been done, if I used other than the predefined S/R levels. This is not in line with what's defined in the setup or plan, but I will add it to the journal as it might be something to think about if similar signals were too appear.

This is what hypothesizing and backtesting are all about.
 
dbphoenix said:
However, if you're taking two contracts at the first S/R and covering one at ATR1, aren't you still holding the other when price moves on to 5854?

Well, the first target is 2x ATR (5.5) at 5843. After that stop is moved to BE and the next target in sight is 3x ATR, 5848.5 which was no problem either. So yes, I would still be in the trade when adding to the position at 5844 at the second S/R. Therefore I would not have entered the second trade with 2 more contracts, but preferably only one (maximum two contracts at any time).

dbphoenix said:
For those who don't have access to intraday DAX charts, it will help if you provide a blow-up that will show the number of points in each move, i.e., something that breaks down the square into something more than 12.5 points. As it is, it's next to impossible to know how many points each bar represents.

I will put up some in-sets or close-ups next time. Indeed on days like this when the dayrange is about 100 points, it can be difficult to read. Yesterday on the other hand, range was a mere 50 points and boxes were only 5 points in length.
 
dbphoenix said:
This is what hypothesizing and backtesting are all about.

Than perhaps I'm finding out what it's all about after all. :|
I was following wasp's journal which is coming up nicely, and I was wondering what certainties you have that your setup that seemed profitable in backtesting will be tomorrow or the day after. It seems none. As you said many times, you must be able to react to the market changes. But if one has built a setup, thoroughly tested it (not like me, but like wasp), than what can you hope for? That it'll work a couple of weeks, a couple of months, a couple of years? There's probably not a point in getting to know the reasons why the market changes as I think the causes over longer time periods are more likely to be found in fundamental analysis. All the trader has to do, is adjust his system, perhaps tweak it only a little or perhaps start from scratch. This isn't anything I should already thinking about in this stage, but reading wasp's doubts and thoughts on the matter...
 
firewalker99 said:
Well, the first target is 2x ATR (5.5) at 5843. After that stop is moved to BE and the next target in sight is 3x ATR, 5848.5 which was no problem either. So yes, I would still be in the trade when adding to the position at 5844 at the second S/R. Therefore I would not have entered the second trade with 2 more contracts, but preferably only one (maximum two contracts at any time).

I must have missed the part of your plan that allows for adding to positions already in place. Please clarify.
 
firewalker99 said:
Than perhaps I'm finding out what it's all about after all. :|
I was following wasp's journal which is coming up nicely, and I was wondering what certainties you have that your setup that seemed profitable in backtesting will be tomorrow or the day after. It seems none. As you said many times, you must be able to react to the market changes. But if one has built a setup, thoroughly tested it (not like me, but like wasp), than what can you hope for? That it'll work a couple of weeks, a couple of months, a couple of years? There's probably not a point in getting to know the reasons why the market changes as I think the causes over longer time periods are more likely to be found in fundamental analysis. All the trader has to do, is adjust his system, perhaps tweak it only a little or perhaps start from scratch. This isn't anything I should already thinking about in this stage, but reading wasp's doubts and thoughts on the matter...


A. There is no certainty, only probability.

B. There is no "hope". One anticipates that the strategy will work until it stops working. Then he adapts it so that it begins to work again.

C. No, there's no reason to know why the market changes. Just accept the fact of change and learn to exploit it.
 
dbphoenix said:
I must have missed the part of your plan that allows for adding to positions already in place. Please clarify.

My analysis of that chart was actually based on a trade-per-trade basis, without looking at the global picture. Quite right, there isn't anything about that in the plan because I think I shouldn't be adding to positions before I have a clue whether my setup holds any probability on profit. Else I would be adding to something that holds a negative expectancy... So if you'll excuse me, this was more an adhoc observation of what I could have done, not what I will do or want to incorporate in the plan (yet...).
 
Trading Journal Template

"If you must play, decide upon three things at the start: the rules of the game, the stakes, and the quitting time."

It's not necessary to answer all the questions, but I think this will help me at the end of the day and also during the day to evaluate not only my trading but also myself. This is something I've been working on for the last couple of weeks. The framework already existed in my mind but I feel the last couple of days were essential for completing the template. On the other hand, it probably will change over time, but I hope it can be a solid foundation.

Setup
Define every step of the preparation process, including every bit of information which is necessary from the days/weeks/months before.
Define exactly what you're looking for (BO, SC, retracement, reversal), where you're looking for it (support, resistance, uptrend, range, congestion, consolidation...), when you're looking for it (wait for confirmation,...). Consider this to be an exercise in "visualizing" the day in your mind, and taking into account several scenarios. For each scenario there should be a corresponding step-by-step guide written out in the plan. Consider changing the setup if it seems unsuitable, incomplete or incorrect at any time.

Plan
Establish a roadmap. The map should be clear on WHERE to go long, where to short, where to enter, exit, take profit, stop, position size, risk. Also HOW to enter a trade (limit/market order) needs to be specified. Consider changing the plan if it seems unsuitable, incomplete or incorrect at any time. The plan should be as such that anybody who has no knowledge about trading, be able to sit down in front of the computer and trade it.

The Trades of Today
# Trades
L xxxx, target 1 @ xxxx, target 2 @ xxxx = +xx
S xxxx, stop @ xxxx = -x
...

The Numbers:Summary
* P/L = xx:xx
* W/L = xx:xx
* biggest loss = xxx points
* max number of successive losses = x
(* average profit, average loss, expectancy,...)

The triangle paradigm
From bottom to top: what I did/thought/felt.
The things I did should be based on acting out the strategy, which is most important: the largest layer from the triangle. What I thought is smaller, but still big enough to identify certain issues and opportunities for improvement or changes to be made. Finally, feelings should be kept to a minimum, hence the smallest layer of the triangle.

  • What I did
- Did I follow my plan to the letter?
- Did I second guess, go off on a hunch, why?
- Did I maintain my discipline? If not, why, how, what happened?
- How will all this affect my preparation for the next day?
- Did I follow the market live whole day/take breaks/traded morning/afternoon,...​

  • What I thought
- What if anything, should be modified in the setup? Based on what (how many) observations?
- Any reasons to modify the entry/stop/target/exit points?
- Is the setup too strict/too loose?
- Is the setup clearly tradeable for an outsider?
- Have you noticed anything's changed in yourself/in the market comparing the last couple of days?
- Any new elements that can be added to the setup (after testing)?​

  • What I felt (introspection)
- How did it feel to follow(abandon) the plan?
- Did I feel my intuition was taking me on a different road?
- Could/should I have done something else?
- Did I have difficulties accepting the outcome of certain trades?
- Describe what happened after a profitable/losing trade (overtrading/revenge trading).
- In what way did yesterday's results affect today's activity?
- Were there any decisions to be made in the heat of the moment? If yes, than how come and how am I going to change to plan to stop this from happening?
- Did anything external from trading influence my behaviour?​

Conclusion
* Where should I focus on? What should I study?
* What modifications am I going to make to the journal/setup/plan/...?


Keeping a journal is the equivalent of an athlete’s practice: it’s not at all unusual to spend far more time training for an event than actually participating in it. If your journal is a hurriedly scribbled paragraph per day, the odds are good that it lacks the specifics you need to accurately assess what you’re doing well and what needs improvement. For full-time traders, trading is a business. The journal is a business plan. The right plan, executed faithfully, can be the difference between success and failure in any endeavor. - Brett Steenbarger
 
Last edited:
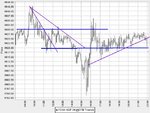
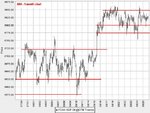
August 28 Preparation

Changes to previous version are in color.

Setup (based on BO's):
- Put up a chart of the past 6 months and draw long term S/R lines.
- Put up a chart of the last month and draw intermediate term S/R lines. (*)
- Add markers at the PDH and PDL: don't act, just observe here.
- Before the day opens, make sure these lines are visible on today's chart (use 5m chart).
- Draw new S/R lines throughout the day, wherever applicable. Add the ATR (9) study.
Try to re-assess the indicated levels and look for S/R as it's developing in realtime throughout the day. Consider that every swing point represents potential S/R.
- Pay closer attention when price moves towards a S/R zone.
- Check if price breaks this level, turns back, consolidates,...
- If price moves away for a minimum of 10 points in the direction of the BO then consider this to be a genuine BO.
- Wait for a price to retrace to that particular S/R level.
- When the retracement happens, there you have a trade (**)
- The entry takes places using a limit order at the exact S/R level. Contrary to the setup of the previous testing days, I'll use a limit order after already one bar has completely formed and touched the S/R level. That way I won't be in trouble if the first bar happens to spike and turn around in seconds.

- Don't add to any positions (yet). If you see an entry opportunity and there's already a position open, than analyze the situation as if this were the first trade, and note what happened.


(*) Try to reconcile two nearby levels into one (e.g. 5695 and 5700 will only act confusing). I will put up new monthly charts each week.
(**) At that point price will likely be moving the wrong way so don't expect price to reverse straight away.


Plan for the day:

Long term S/R levels:
6200, 6100, 5950, 5850, 5750, 5600 [Added 6100, 5850]

Intermediate term S/R levels:
5850, 5800, 5775, 5725, 5625, 5575 [Removed 5825, 5750]

PDL = 5795 / PDH = 5842

Taking a look at the 6-months chart, we see that price has been pushing against R @ 5850 for the last week. Possibility for a BO above that level, or price could be falling back to 5775 before the uptrend continues.

Look for trades long (only in the direction of the trend):
5850: Long after price breaks up through this level on upside and moves to 5860 or further, before recoiling back to the line. Stop is at ATR, first target is 2x ATR, second 3x ATR, because ATR is dynamic and objective. Enter with two contracts, two different targets, minimum risk/reward of 1:2. After first target hit, move stop to BE. This then defines the exit.

Need to look for resistance above that level, but apart from 5950 there doesn't seem to be anything apart from "air" for over the past year.

Look for trades short (only in the direction of the trend):

5800: Short after price drops through this level on downside and moves to 5815 or further, before recoiling back to the line. Stop is at ATR, first target is 2x ATR, second 3x ATR, because ATR is dynamic and objective. Enter with two contracts, two different targets, minimum risk/reward of 1:2. After first target hit, move stop to BE. This then defines the exit.

And so forth for any other long or short S/R level within reach.
! This time we'll be looking for possible trades on intraday S/R levels taking into account that every swing point potential S/R represents.
 

Attachments

  • dax1month.jpg
    dax1month.jpg
    64.2 KB · Views: 200
  • dax6months.jpg
    dax6months.jpg
    74.6 KB · Views: 208
Last edited:
August 28 Summary

The Trades of Today
# Trades
None. None of the BO offered a decent retrace or a BO of at least 10 points coincident with a definite trend.

The Numbers (Summary)
* P/L = 50:17
* W/L = 1:3
* biggest loss = 8.5pt
* max number of successive losses = 3


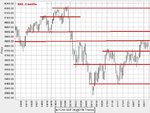
What I did

As I wrote in the plan for the day I imagined a possibility for price falling back to 5775 before the uptrend continued. Because price went all the way back to 5800 I believed the fallback to 5775 to be a retest of that level. From that point onwards, I then trendlines and tried to assess short term S/R levels. I followed my plan for all the other parts and did what I was expected to do.

What I thought

At 1100 below 5800 I didn't see the necessary signals to decide that price was in a downtrend. Immediately ater the first high of 5815 price made the first low at 5795. It then made a LrH, but not a LrL (twice at 5795).

From the short term S/R levels, none of those had BO for 10 points before they retraced back to the line to enter. So we were basically left with no trades, although price was moving nicely and went up more than 100 points during the day.

In the future - not applicable on today's trading day - I will try to take a better look at exits. Dbphoenix said the chart will tell me where to exit, and perhaps that's a better way of analyzing targets instead of just using an arbitrary ATR value. But first, we have to make some trades available...

What I felt (introspection)

I feel that there could have been more in it. A nice upmove was completely missed. I don't need to pick every opportunity but with no trades during the whole day, this isn't satisfactory. I feel I could have entered around 1400 with a higher probability for price moving upwards. I thought my system offered few possibilities in a choppy and trendless ranging day, but if it offers me zero possibilities in these kind of circumstances than perhaps I should look for something else or loosen some of the parameters.

Conclusion
- If I stick to that 10 points margin for a valid outbreak, I'm gonna miss a lot of opportunities.
- Possible modifications: use 10 points as a target for intermediate/long term S/R levels, but for short term a smaller number can perhaps open some options.
 

Attachments

  • 20060828b.JPG
    20060828b.JPG
    68.5 KB · Views: 207
Last edited:
August 29 Preview

Basically, setup and plan or the same as yesterday. One little tweak (cfr. infra):

Long term S/R levels:
6200, 6100, 5950, 5850, 5750, 5600

Intermediate term S/R levels:
5850, 5800, 5775, 5725, 5625, 5575

PDL = 5775 / PDH = 5880

Looking for a continuation of the uptrend, following a retest of 5850.

Short on the intermediate/long term S beginning at 5850.
Long anywhere above that level when intraday S/R develops (perhaps already at 5875-5880?). Will ignore then 10 points BO requirement and see what entries are possible taking a BO at about the ATR range at that point in time, of course waiting for the retracement. Otherwise no changes to the setup or plan.
 
just a thought

instead of looking at ATR for a target, look only at it for placing your stop... look where price is moving and let the next S level (in a downtrend) or R (in an uptrend) determine where to exit...

or let the first target be 2x ATR, and the second the next S/R level...
 
August 29 Summary

The Trades of Today
4 Actual Trades out of 5 Possibilities
None. None of the BO's actually happened on the S/R lines I previously defined. So if I'd followed my system without the adjustment of yesterday this would have resulted in another day without any trade.

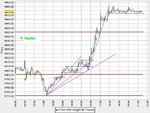
On the chart long trades are marked with green dots, short trades with red dots. These dots mark the entry point.

L @ 5869, stop at 5863 (ATR=6), target = next R level but as we don't have anything within a reasonable range I had no choice than to let ATR determine my target: first at 5875, second at 5881. So one succesful trade = + 18pt.

L @ 5878, however, we don't add to positions to this one was left to observing only. With ATR 5 at that moment, first and second target would actually have been hit.

S @ 5882, ATR=3, first target ok at 5879, second at 5876. But at this time the blue line at 5873 was a possible level to target. So instead of using ATR for both targets I moved my stop to BE after hitting 5879, hoping for price to continue downwards. Fortunately it didn't hit my stop when price spiked up to 5884 and profits were 3 + 9= 12 points.

S @ 5874, ATR=8, I didn't have a target other than 5850 but I decided to leave the trade open and see what happens. So first contract out at 5858, second at 5850, which coincidentally happens to be 2x ATR and 3x ATR. Profits = 40 points.

L @ 5863, now I had something to focus on and made my first target (ATR 7) at 5870 and unfortunately this time my stop was hit because I moved it to BE. If I had placed the stop only a little beneath the S line, I would have still be in the trade with a profit of another 10 points because the next target in sight would have been the R at 5882. Profits 7 points.

The Numbers (Summary)
* P/L = 127:17
* W/L = 5:3
* biggest loss = 8.5pt
* max number of successive losses = 3


What I did

As I wrote yesterday, I imagined price falling back to 5850 before continuing upwards. I seemed to be right as this is what happened in the morning. I entered every trade not on the first time price hit that level, but on the second bar.


What I thought

I followed my plan however got into a bit of trouble with drawing intraday S/R levels (see the small line on the chart). I wasn't quite sure where price was finding support, around 5873, 5877.5, 5882 or all three of those?

I also focused on S/R levels as identifying them as levels where price had trouble getting by and checked for the number of points that hit/crossed that level. So instead of just drawing them at the outer edges where price reversed I took a slightly different approach which might just happen to be what I need.


What I felt (introspection)

I felt like I was walking in the dark, without having the moon or a flashlight to guide me because of the lack of S/R lines from previous days/weeks. I checked the PDH/PDL but they didn't seem to hold much anyway. Fortunately I got off a good start because I believed that buyers/sellers were having some issues with the 5868 level which than turned out to hold support for the pullback that followed after the WRB's around 1030.

Although this day has been particulary profitable, I don't feel it's anything more than based on me drawing S/R lines which happened to turn out right. That, with the fact that the moves were quite clear and nice today. It will be interesting to see what happens in a ranging day.

Conclusions:
- Using intraday S/R levels has shown to offer more winning trades.
- Using the next S/R level as target, can be interesting. For playing it safe, use ATRx2 as the first target. It's a first step in "letting your profits run".
 

Attachments

  • 20060829b.JPG
    20060829b.JPG
    68.2 KB · Views: 221
  • 20060829.jpg
    20060829.jpg
    62.8 KB · Views: 160
Last edited:
August 30 Preview

No changes to the plan. I liked it the way it was today.

Long term S/R levels:
6200, 6100, 5950, 5850, 5750, 5600

Intermediate term S/R levels:
5850, 5800, 5775, 5725, 5625, 5575

PDL = 5845 / PDH = 5890 => remarkable small range opposed to the day before

Take into consideration the new S/R levels of today (5873, 5882, 5888) but this doesn't necessarely mean price will find the same tomorrow. Check for levels around those prices, like 5870-5875, 5885-5890...
 
Since you've gone back to the development stage in order to define your setup, the numbers you've been keeping are no longer valid. They may serve as a reference to the trades you made prior to today's, even though there weren't very many, but you'll have to start over when you begin testing a setup again.
 
dbphoenix said:
Since you've gone back to the development stage in order to define your setup, the numbers you've been keeping are no longer valid. They may serve as a reference to the trades you made prior to today's, even though there weren't very many, but you'll have to start over when you begin testing a setup again.

I thought (back)testing a setup was about defining it also? Anyway, I don't mind the numbers as much, in this case it's only about 3 trades. Do you think the "what I did, thought, felt" is better described this way? Only I can tell of course, we'll have to see if it helps me but it's much more detailed than before. I'll welcome any further tips or suggestions
 
In order to test something, it has to be defined. Otherwise, there's nothing to test. Once the testing process begins, refinements will suggest themselves. However, since you changed your setup so quickly, this suggests that the setup was not adequately defined to begin with. Since you've elected to go through this process in real time rather than through backtesting, it will take a great deal longer.

In any case, whatever numbers apply to one setup aren't going to apply to a different setup. Apples and oranges.
 
dbphoenix said:
In order to test something, it has to be defined. Otherwise, there's nothing to test. Once the testing process begins, refinements will suggest themselves. However, since you changed your setup so quickly, this suggests that the setup was not adequately defined to begin with. Since you've elected to go through this process in real time rather than through backtesting, it will take a great deal longer.

In any case, whatever numbers apply to one setup aren't going to apply to a different setup. Apples and oranges.

I'd have no problem with doing the same with 20 historic charts instead of 20 real time days, but the latter is what you asked me to do.
 
Status
Not open for further replies.
Top