firewalker99
Legendary member
- Messages
- 6,655
- Likes
- 613
August 24: Preparation...*update*
Setup:
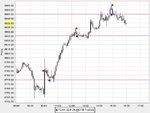
- Put up a chart of the past 6 months and draw long term S/R lines.
- Put up a chart of the last month and draw intermediate term S/R lines. (*)
- Add lines at the PDH and PDL: don't act, just observe here.
- Before the day opens, make sure these lines are visible on today's chart (use 5m chart).
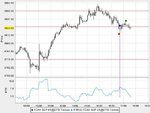
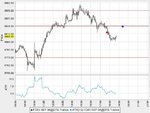
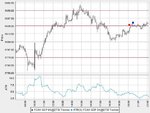
- Draw new S/R lines throughout the day, wherever applicable. Add the ATR (9) study.
- Pay closer attention when price moves towards a S/R zone.
- Check if price breaks this level or turns back.
- If price moves away for a minimum of 10 points in the direction of the BO then consider this to be a genuine BO.
- Wait for a price to retrace to that particular S/R level.
- When the retracement happens, there you have a trade (**)
- The entry takes places using a limit order at the exact S/R level.
(*) Try to reconcile two nearby levels into one (e.g. 5695 and 5700 will only act confusing).
(**) At that point price will likely be moving the wrong way so don't expect price to reverse straight away.
Plan for the day:
Long term S/R levels:
6200, 5950, 5800, 5750, 5575, 5400, 5300
Medium term S/R levels:
5850, 5825, 5775, 5750 ,5725, 5615
Take only long and medium term S/R levels that appear on the chart of the next day and are within a "reasonable" range of the previous trading day ranges. E.g. 6200 or 5300 are outside of that.
5850: Long after price breaks up through this level on upside and moves to 5860 or further, before recoiling back to the line. Stop is at ATR, first target is 2x ATR, second 3x ATR, because ATR is dynamic and objective. Enter with two contracts, two different targets, definining a minimum risk/reward of 1:2. After first target hit, move stop to BE. This then defines the exit.
5825: Long after price breaks up through this level on upside and moves to 5835 or further, before recoiling back to the line. Stop is at ATR, first target is 2x ATR, second 3x ATR, because ATR is dynamic and objective. Enter with two contracts, two different targets, definining a minimum risk/reward of 1:2. After first target hit, move stop to BE. This then defines the exit.
And so forth for 5825, 5750, 5725.
In turn, this depends on where price opens the next day: taking only long position of course when the trend is up and price is moving up through that resistance level, shorting when the general trend is down and price breaks the support. For instance:
5775: Short after price drops through this level on downside and moves to 5765 or further, before recoiling back to the line. Stop is at ATR, first target is 2x ATR, second 3x ATR, because ATR is dynamic and objective. Enter with two contracts, two different targets, definining a minimum risk/reward of 1:2. After first target hit, move stop to BE. This then defines the exit.
And so forth for 5750, 5725.
Setup:
- Put up a chart of the past 6 months and draw long term S/R lines.
- Put up a chart of the last month and draw intermediate term S/R lines. (*)
- Add lines at the PDH and PDL: don't act, just observe here.
- Before the day opens, make sure these lines are visible on today's chart (use 5m chart).
- Draw new S/R lines throughout the day, wherever applicable. Add the ATR (9) study.
- Pay closer attention when price moves towards a S/R zone.
- Check if price breaks this level or turns back.
- If price moves away for a minimum of 10 points in the direction of the BO then consider this to be a genuine BO.
- Wait for a price to retrace to that particular S/R level.
- When the retracement happens, there you have a trade (**)
- The entry takes places using a limit order at the exact S/R level.
(*) Try to reconcile two nearby levels into one (e.g. 5695 and 5700 will only act confusing).
(**) At that point price will likely be moving the wrong way so don't expect price to reverse straight away.
Plan for the day:
Long term S/R levels:
6200, 5950, 5800, 5750, 5575, 5400, 5300
Medium term S/R levels:
5850, 5825, 5775, 5750 ,5725, 5615
Take only long and medium term S/R levels that appear on the chart of the next day and are within a "reasonable" range of the previous trading day ranges. E.g. 6200 or 5300 are outside of that.
5850: Long after price breaks up through this level on upside and moves to 5860 or further, before recoiling back to the line. Stop is at ATR, first target is 2x ATR, second 3x ATR, because ATR is dynamic and objective. Enter with two contracts, two different targets, definining a minimum risk/reward of 1:2. After first target hit, move stop to BE. This then defines the exit.
5825: Long after price breaks up through this level on upside and moves to 5835 or further, before recoiling back to the line. Stop is at ATR, first target is 2x ATR, second 3x ATR, because ATR is dynamic and objective. Enter with two contracts, two different targets, definining a minimum risk/reward of 1:2. After first target hit, move stop to BE. This then defines the exit.
And so forth for 5825, 5750, 5725.
In turn, this depends on where price opens the next day: taking only long position of course when the trend is up and price is moving up through that resistance level, shorting when the general trend is down and price breaks the support. For instance:
5775: Short after price drops through this level on downside and moves to 5765 or further, before recoiling back to the line. Stop is at ATR, first target is 2x ATR, second 3x ATR, because ATR is dynamic and objective. Enter with two contracts, two different targets, definining a minimum risk/reward of 1:2. After first target hit, move stop to BE. This then defines the exit.
And so forth for 5750, 5725.
Last edited: