E-mini S&P Elliott Wave Discussion

ANNOUNCEMENTS:
This will be the last market update for the year. The next update will be on Monday, January 3, 2011.


ELLIOTT WAVE ANALYSIS:


The markets that I'm going to cover tonight are the E-min S&P and Gold.

S&P


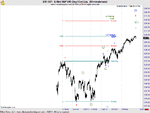
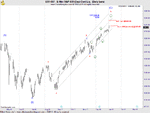
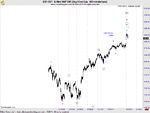
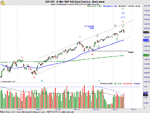
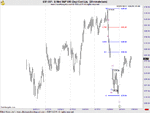
The ES_F market reached the first target for w.v of w.5 of w.(C) of w.(2) of 1258 - 1258.50. The final hour of trading yielding a bearish engulfing candle which is also an outside bar. I'm expecting some weakness in the ON session or early on in the regular session. Trade has been on light volume so it's hard to get to excited absent of a completed five wave decline that draws down below 1247. For further details on other upside targets see http://elliottwavelive.blogspot.com/2010/12/market-pulse-daily-perspective_27.html

Gold

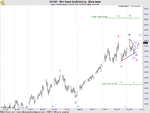
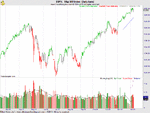
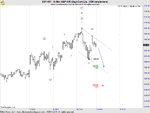
Gold has traced out a w.4 triangle that completed at 1372.4. The initial upward thrust should carry this market to 1423.1 that would complete w.1 circle.

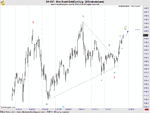
Interestingly, Gold has most recently developed high-high and low-low cycles. Looking at the daily chart above, from w.3, the number of trading day counts are provided. Accordingly, the next high should be reached on January 3-5 +/- 1 day. This bodes well with the current wave labeling.

Best of Trading
 

Attachments

  • ES_F.gif
    ES_F.gif
    28.8 KB · Views: 143
  • Gold_d.gif
    Gold_d.gif
    29.3 KB · Views: 195
  • Gold_240.gif
    Gold_240.gif
    31.8 KB · Views: 172
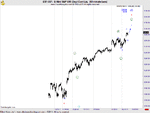
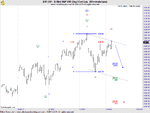
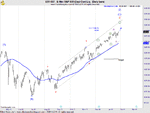
Today the markets began the year with a bang. The wave structure counts well on the daily and 60 minute charts. W.(2) may have ended right at one of the potential targets (1271.5) that I mentioned for the termination of w.(2) during my 12/27/2010 post. There was a minor decline at the close but we do not have any evidence that this rally has indeed ended. Given this information it is prudent to be cautionary. I've also labeled the chart where w.5 =w.1 at 1291.75. Should the wave structure continue to subdivide, this upside target would certainly be the next level to look at for the termination of w.(2) and a subsequent failure.

Tomorrow I'll be looking for the market to prove itself with a follow through day. If this doesn't materialize, I'll be looking at how the market reacts surrounding 1227.5.
 

Attachments

  • ES_D.gif
    ES_D.gif
    31.1 KB · Views: 177
  • ES_60.gif
    ES_60.gif
    24.8 KB · Views: 192
There is little to discuss tonight that adds to my current view that the market will rally to the 1291 area. The price action since 1/3/11 is clearly corrective. However the market on the weekly chart level is OB and 1275 seems to have proven to be formidable resistance.

The USD has rallied in five waves from it's low (79.03) established on 12/31/10. The decline in the dollar was expected and given the negative correlation between equities and the Dollar, the stage may be set for further advances in the ES_F.

One word of caution. The market has made three distribution days since the beginning of trade in 2011. Distribution occurs when supply (sellers) are outstripping demand ( buyers). I have labeled each distribution day (when trading volume is heavy when price declines or when little upward progress has been made (churn). When distribution occurs, it's a prelude to a drop in price that may come days or even weeks later. Distribution by itself is not a stand alone buy or sell indicator but it is a tool that I use to confirm topping price action.

Although the wave count suggests higher prices, the fact remains that this market is way extended and a significant correction is long overdue.


Best of Trading
 

Attachments

  • Distribution.gif
    Distribution.gif
    39.7 KB · Views: 148
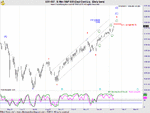
The final stages of w.5 are underway and the wave structure is very mature in it's development. I have attached the daily and 60 min chart levels that break down the wave structure. The current wave looks incomplete and would count well with a final push upward. Since my target for the termination w.(2) is 1291.75, this is a logical expectation.


With the exception of the Nasdaq, ROC Momentum signatures for the Dow, Russell and S&P continue to exhibit a tiring market. Again, one would expect this signature as the final stages to the rally are now in place. Given that the Nasdaq is the outlier, I'll need to see more than one market top tomorrow along with a minor five wave decline. Any continued strength past tomorrow would not bode well for the existing wave count. Let's see what develops ON and into the day session.


Best of Trading
 

Attachments

  • ES-60.gif
    ES-60.gif
    24.3 KB · Views: 198
  • ES-D.gif
    ES-D.gif
    35.3 KB · Views: 172
The Market finally cracked or did it? Today's opening gap down was followed by significant selling pressure on heavier volume. While the price action looks impulsive on lower time frames, one day doesn't confirm that a tradable top is in place. For tomorrow I'm anticipating a rally that should not exceed 1295 if w.(2) had indeed ended. After an initial five wave decline, the first rally (a second wave) from the beginning of a directional trend change will fail on what appears to be a strong opening but by the time the market closes it's down for the day on heavy volume. Astute market technicians will not be fooled as volume will contract as wave c completes. Also, on an hourly chart a technician will be able recognize when the rally fades (a completed w.c) and an increase in volume as selling resumes. This will add to the bearish case. If this decline is for real, the near term target is the previous forth wave (1172.25).

Best of Trading
 

Attachments

  • ES_F_D.gif
    ES_F_D.gif
    37.8 KB · Views: 191
I have confirmed a five wave initial decline from 1295 that was followed by a three wave counter trend move that completed at 1288. Regardless of whether you're a bull or bear... according to the rules and guidelines of EWP, at a minimum this market should move to the OP and complete a 5-3-5 patttern. A more bearish view is to target the 1.618 extension is where w.iii = a 1.618 multiple of w.i.

Best of Trading
 

Attachments

  • SP.gif
    SP.gif
    24.6 KB · Views: 140
Tonights update will be brief as tomorrow starts the FOMC meeting. Today's advance cau me off guard. In my weekly publication Heard On The Street , I anticipated a further decline today. That's not what happened. Instead the market rallied to a .786 retracement of the decline that began from 1295.

If the initial decline is a top, 1295 is the line in the sand that can't be voliated to maintain a bearish view. Based upon the strong close, price may rally in the ON session or earily on tomorrow. If w.(ii) is still unfolding, a common relationship exists where w.c = .618 w.a at 1291.25.

Bottom Line: Price must turn tail or the S&P will reach a new recovery high and confirm the Dow's advance. The implications of such would mean that w.(2) was still unfolding. If you have been reading all along, that's why we need confirmation ! Let's see what happens.


Best of Trading
 

Attachments

  • SP.gif
    SP.gif
    28.3 KB · Views: 161
The ES-F reached a new recovery high today that effectly removed any bearish bias. It is confirmed the DOW's leadership... a negative sign for the bears. If you are watching price action you know that this market is struggling to stay afloat.

The new high means that our next expansion that may be the termination point of w.5 is where w.5 = .618 (w.1-3) at 1306.25. I've also made a slight relabeling of the subdivisions of the most recent advance from w.4 for your review.

Developing patience to wait and wait some more for the market to make it abundantly clear when it is time to climb aboard is paramount. Don't jump the gun. While we attempt to label the appropriate substructure as an exercise,... trying to call a top often takes several attempts and is costly to your account and mental attitude. Market manipulators routinely run stops before moving the market the other way. Simply put, IMO, a trader should never trade the the terminus of w.5. Let the market commit to you before you commit your hard earned money to it.

Tomorrow is another day. Until I see a completed five waves down, a tradeable top is not in place.


Best of Trading
 

Attachments

  • SP.gif
    SP.gif
    31.8 KB · Views: 156
As expected, the S&P completed w.i circle and rallied. I've labeled the substructure for your review. Second waves typically retrace 50%- 62% of the previous wave, with 62% being most common. By looking at the current wave structure, there are a number of possibilities that could be unfolding. I'll have to see more of the wave structure to be certain but I will post an updated chart and discuss the implications thereof.
 

Attachments

  • SP.gif
    SP.gif
    30.7 KB · Views: 163
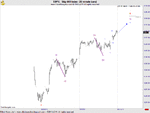
The last time we spoke I was looking for a new high in this market. Friday's price action carried the market to a new high... one that reached the targets stated in the 2/9/11 post of 1326.75 - 1329.25. If you review that post v.s. the wave count that I have presented here tonight, you will notice that I have changed the substructures of w.5 (red) to reflect greater proportionality between waves w. ii (purple) and w.iv (purple). Notice that the declines are harmonic in both price (14.03 and 13.07) and in time (15 and 14 bars) respectively. While the last few price bars from w.iv (blue) can be counted complete, I think that the market will extend higher in one final push.

Should the market extend higher it is important to note that currently w.(iii) < w.(i), therefore, w.(v) can't extend further than 1341.8 in $SPX and 1340 for ES1-057 or w.(iii) will be the shortest wave and that would break the rules and guidelines of EWP. So from a trading perspective, we now have our lines in the sand where price MUST reverse or the count is incorrect.


We'll see what this week brings.

Best of Trading
 

Attachments

  • SP.gif
    SP.gif
    21.1 KB · Views: 164
The move up is almost over EWT..............I have the 71.6 retracement from the big move down for the DJIA at 12360 area. Since I only trade currencies then I have already been trading well, because they as well commodities, have already been going down.

Good Trading Everyone.
JahDave
 
JahDave,

I'm inclined to agree on certain commodities but cross pairing against the USD, I'm not to certain as the wave pattern in muttled. At higher TF the USD looks like its in a triangle that implies that a new low would be reached. My commodity count also agrees with this therefore, I am expecting a correction in the equity and commodity markets but followed by a fifth wave up.

I have gold and oil as being in a wave two right now, but Tuesday I was talking to a trader friend of mine and I told him that I thought gold and oil had put in highs, silver did not look like it. Then I checked charts and saw that silver had made a new high today. Wow,,,,,,Elliott Wave works,,,,,,but R.N. Elliott himself said that EWT can not predict time or size of moves, only that patterns repeat. I personally use technical indicators to validate my wave counts. I use 5 different things and if they don't line up then I don't trade 95% of the time.......I would not trade any U.S. Indexes at this time.............but I think I would go short at the 12360 without any technical confirmation because I believe strongly in this. I will say again that I only trade my own work and in my own way. Good, bad or indifferent I always accept full responsibility for my trades and my opinion is that every trader should feel this strongly about trading their own analysis as well. In my opinion the bottom line is that every trader should educate themselves and develop and trade their own systems. I think you are the second best technician on this site EWT..........(Of course I'm first......LOL)......You are a great technician and I am sure you will do great things in the markets.

Good Trading,
JahDave
 
Top