E-mini S&P Elliott Wave Discussion

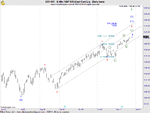
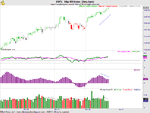
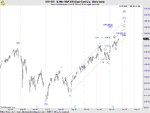
On Monday I stated that price action either began a complex w.iv decline or it ended at the 1214.75 low. Yesterday a new high was struck that might indicate that w.3 had been struck. However, today's decline still leaves the potential for a more complex forth wave at the daily chart level. What's important is that we recognize that the decline from 1124.75 is an unfolding forth wave (either w.iv or w.4) on lower time frames. Therefore on a short term basis I am looking down. Downside targets are between 1180.5 - 1153.25 ( the .236 and .386 retracements of wave 3) on the daily chart level. A close beneath 1126.75 on the daily chart level would create wave overlap that would signal that a significant top had been struck. In my next Week In Review I will be discussing several alternative wave counts that lead me to believe that a significant decline is still in forthcoming.

After the close Cisco reported earnings that beat but the stock sold off hard. The NQ_F are down significantly while the YM_F and ES_F are also down. So unless this is a fake out in the ON session, I expect weakness at the open.

Here's the Market's Position as of the close:

Momentum Indicators: OB on Weekly and Daily chart levels but both have turned down indicating a possible selling opportunity. 60 min chart is bullish and in OB territory.

Pattern: At weekly chart level: w.iv or w.4 of w.c of wave.2 ( or other alternative counts instead of w.2 - all with bearish implications)

Time: No change from previous comment.

Trade Strategy: Looking to establish a bearish position as 60 min momentum indicator makes a bearish reversal. Downside targets are between 1180.5 - 1153.25.


Best of Trading
 

Attachments

  • S&P_1.gif
    S&P_1.gif
    26 KB · Views: 171
QE2 vs Elliott Wave Theory. Which One Wins Out?

In this weeks review I want to spend some time looking at the bigger picture and other possible wave counts that may provide us with an additional bias as to where the market is heading. Currently I have already presented a scenario under what I will call Scenario #1 whereas Intermediate w.(c) of w.b is still underway with initial targets of 1237-38 or 1343.6. Thereafter, a decline greater than the Great Depression should ensue. This is the "Dooms Day Scenario"

Under Scenario #2: the current rally is viewed as minor w. B of Intermediate w. (B) is unfolding as an expanded flat correction whereas w. B exceeds the origin of w. A. This implies that w.B would extend higher once the current decline that began on 11/9/10 ends. I'll post termination points as soon as they can be identified ... that is if this scenario plays out. Once w. B is complete, a five wave decline would be called for that would terminate significantly below 1003.1, possibly at the 1.382 reverse fibo of the distance between w.A and w.B .

Under Scenario #3: the current wave pattern would unfold in a triangle fourth wave. The current rally whether complete or not should result in a sizable decline in three waves proportionate to a .618 retracement of w.( a - b). This implies a possible decline below 1003.1. Of course much depends on the significances of any further advance. For sake of argument, we'll assume that w.c will terminate below 1003.1. Thereafter w.d and w.e will also unfold in three waves to complete w. IV. Thereafter a new recovery high above w.III would occur.


Conclusion:

Each scenario presented projects that price will make new lows before any rally of significant proportion. When several Elliott patterns like this agree with respect to direction there is obviously a higher probability that price will trade in that direction. I believe that its only a matter of when.


Best of Trading
 

Attachments

  • ES_1.gif
    ES_1.gif
    23.4 KB · Views: 163
  • ES_2.gif
    ES_2.gif
    21.7 KB · Views: 174
  • ES_3.gif
    ES_3.gif
    20.7 KB · Views: 153
Selling pressure continued today even though traders tried to buy the market at the open. The decline from the highs does not appear to be complete. The decline could be the start of w.3 as I depicted in the week in review or just a w.4 correction. The fact that selling pressure was on weak volume infers that the later is the preferred count. The daily chart show that w.4 should be a sideways affair since the rule of alternation apply whereas w.2 was a sharp correction and w.4 should then be either a triangle of flat correction. My target for the decline is 1153.25.

I've added another daily chart showing an indicator that Jeff Kennedy of EWI developed. Note what transpires as the black MOAD line drops below the purple 30 ma. Should this occur, a sizable sell off would occur. The indicator last made a similar cross right after the April top. I'll be keeping a close eye on this indicator as it confirms that more bearish scenario.

Finally, at the 60 min. chart level I've labeled the wave structure as well as included the corrective price channel. As long as price remains within the channel during the decline... the structure remains corrective. That would be consistent with the interpretation at the daily chart level.

Here's the market's position at the close:

Momentum: Remains OB but turning down on weekly. Daily and 60 min. time frames are bearish but nearing an OS condition.

Pattern: wave.iv of wave.c of wave.2.

Time: No analysis made.

Trade Strategy: Remain flat. Further downside is expected but limited in my opinion. Should daily and 60 min chart levels make a bullish momentum reversal, price should rally. Once that has exhausted itself I expect another wave of selling. I'll be looking to establish a bearish position as momentum indicators and price confirm a top is in place.


Best of Trading
 

Attachments

  • ES_3.gif
    ES_3.gif
    26.3 KB · Views: 156
  • ES_1.gif
    ES_1.gif
    27.8 KB · Views: 164
  • ES_2.gif
    ES_2.gif
    26.7 KB · Views: 138
Today was certainly a snoozer... that is until 2:50 est. As most of you know from my Twitter posts, identifying the current wave count on lower TF's was difficult as prices chopped back and forth. Sideways corrections are always difficult to identify the termination points because there are numerous corrective structures and combinations thereof. That brings me to a great lesson. When the water is murky... meaning a trader can't identify the wave pattern with absolute uncertainty, then stand down and wait until the water is clear. A trick that I use in such times of frustration is to find the lowest TF that I can find where the wave structure is clear. Often this will be at the 60-120-240 chart level.

After the market closed I noticed that the 120 min chart provided the clarity I needed. Here's what I know. The current wave structure has unfolded in a 3-3 wave pattern (w.a and w.b). Any pattern that starts with 3 waves is a corrective pattern. Therefore my bias to the downside i.e. new low is still intact. Any wave structure that begins in 3 waves c can also be tricky as several possibilities exist. W.(iv) could unfold in a triangle or a flat correction. The difference is that under the flat interpretation, price will trade ABOVE 1182, most likely to 1184.75 with w.c in 5 distinct waves. Other reisitance levels are provided within the chart.

Possible targets for the termination of the triangle's interpretation (not shown) will have it's termination point located between w.a and w.b. Regardless of which interpretation plays out, traders who positions themselves correctly can capitalize on the fact that new lows will eventually be reached.

Tomorrow I'll be watching this market closely to identify the operative wave count as well as targets for the next move to the downside.


Best of Trading
 

Attachments

  • ES_F_120min.gif
    ES_F_120min.gif
    27.2 KB · Views: 187
Announcements:
Due to the Thanksgiving holiday, there will not be a week in review published for 11/22- 11/26.

The Week In Review:
The month of November has been strong for all dollar denominated asset classes as investors rationalized buying everything in hope that the FED will create inflation and drive markets up. In November, the Daily Sentiment Index for the S&P reached 94% bulls and the AAII Investor's poll reached 57.6% bulls. Both readings are the highest since January 2007. Considering the optimism for stocks that transpired near the market's high of 10/12/2007 and the weak economy, it's not hard to reason from a contrarian viewpoint that most investors who counted on the FED's easing before and are now even more bullish than 2007 will also suffer a similar fate when they least likely expect it.

With Thanksgiving only days away here in the U.S., I think most readers expect a week of low volatility as traders are more focused on the "bird" than QE2, USD, equities and commodities. It's often during these holiday times that I take some time to review my trade plan, goals for next year and a good old fashion dose of "Chartfest"... basically, I'm looking at allot of markets. In the next couple of weeks I'll be posting the charts of crude oil, copper, USD, some sectors and individual stocks.


However, I try not to take anything for granted. Note that the following chart shows converging moving averages as annotated by the blue circles. Analysts call this condition "market compression". I find that when this occurs there is a high probability for a big market move. Also not that I've circled several places on the chart when all three moving averages converged. Draw your own conclusions but the subsequent moves seem rather definitive to me. Unfortunately, most traders don't know what direction the market will trade by just looking at the chart. That is unless you have Elliott Wave in your trading toolbox. So let's try to explain why the market is compressing and the expected direction of the market using the wave principle.

ES_F Forecast:

At the daily chart level, I'm still working a w.4 retracement whereas the wave pattern should unfold in either a flat correction or a triangle, followed by a new recovery high. This interpretation bodes well for a market that undergoing compressing. Between the flat and triangle, the triangle interpretation (see 60 min. chart levels) would best explain the market compression that we find developing at daily chart level. Under each of these interpretations, a decline below w.1, roughly the .50 retracement of w.2 - w.3, would eliminate another high in the rally that began in July from w. (B) and call for a larger decline. While, I remain open to this possibility, I don't think the probability of such an event is high.


Turning my attention to the 60 min. chart levels, I've shown the charts for flat and triangle interpretation. Until I see how the pattern is unfolding, I can't make a near term forecast beyond what I have noted.

Here's the market's position as of the close on 11/19/2010.

Momentum: Weekly is OB and has turned down. Daily is bullish but not OB. 60 min. is OB.

Pattern: W.c of wave.2. Either a triangle or flat correction for w.4

Time: No analysis made.

Trade Strategy: Remain flat until w.4 wave pattern becomes clearer.

Conclusion: Once w.4 ends, the market should push higher in an impulsive manner. Expect a new recovery high that is telegraphed by the three moving average convergences at the daily chart level.


Best of Trading
 

Attachments

  • ES_F_trianlge.gif
    ES_F_trianlge.gif
    27.8 KB · Views: 177
  • ES_F_flat.gif
    ES_F_flat.gif
    24 KB · Views: 162
  • MOAD.gif
    MOAD.gif
    27.9 KB · Views: 170
  • ES_F_daily.gif
    ES_F_daily.gif
    26.4 KB · Views: 160
Last time I left the readership with the thought that the market is working a minor degree w. developing in either a flat or triangle corrective structure. As long as 1171 holds my view of the wave structure remains intact.

From the two charts that were presented in the week in review, I was anticipating an advance. That advance was achieved in the ON session and terminated just above the .618 retracement (1204.75). In doing so but failing to push higher necessitates a slight labeling change based upon today's price action but it doesn't effect the overall interpretation of structures for minor w.4. Either interpretation is still valid.

Looking at the 60 min. chart, I am anticipating a modest push up tomorrow but I am uncertain as to whether w(b) ? had ended. Don't be surprised if the market makes another push down to test the lower trendline of the triangle. Should price extend well beyond the .786 retracement in tomorrows trade, odds start favoring the flat interpretation.

Here's the Market's position at the close:

Momentum: Weekly is OB and has turned down. Daily is bullish but not OB. 60 min. is bullish.

Pattern: W.c of wave.2. Either a triangle or flat correction for w.4

Time: No analysis made.

Trade Strategy: Remain flat until w.4 wave pattern becomes clearer.

Best of Trading
 

Attachments

  • ES_F_triangle2.gif
    ES_F_triangle2.gif
    29.8 KB · Views: 168
Fist of all, I'd like to wish all my readers who celebrate Thanksgiving a happy and safe holiday.

The market continues to unfold in a choppy and sideways manner that is consistent with corrective structures. As I have previously mentioned, w.4 is unfolding in either a triangle or flat correction. The extent of the current rally from 1174.75 doesn't count complete so I will be looking higher to 1203.75 whereas w(c) = w (a) to complete w.b circle. Should price exceed this level, other targets exist between 1212.75 - 1217.3 depending on what type of triangle or flat develops.

Here's the market's position:

Cyclic Momentum: Weekly is bearish but not OS. Daily is bullish but not OB. 60 min. is OB.

Pattern: Either a triangle or flat correction for w.4

Time: No analysis made.

Trade Strategy: Remain flat until w.4 wave pattern becomes clearer.

Best of Trading
 

Attachments

  • ES_F.gif
    ES_F.gif
    29.1 KB · Views: 165
Today's session continued to demonstrate sloppy price action. Today's decline below w(a) blue (1174.75) forces an adjustment to the previous wave labeling whereas w.b circle is still unfolding. Unfortunately I can't determine if w.4 is unfolding as a triangle as the proposed chart indicates or if the flat interpretation will prevail. Until the wave structure clearly identifies the operative wave count, both interpretations remain valid. As a reminder, either interpretation eventually leads to a new recovery high above 1224.75.

There is one uncertainty that I am watching, i.e. should price decline below 1171, odds are that a much larger decline would ensue and my wave labeling is wrong.

Here's the market's position at the close:

Cyclic Momentum: Weekly is bearish but not OS. Daily is neutral. 60 min. is bullish, approaching OB.

Pattern: Either a triangle or flat correction for w.4

Time: No analysis made.

Trade Strategy: Remain flat until w.4 wave pattern becomes clearer.

Best of Trading
 

Attachments

  • ES_F.gif
    ES_F.gif
    29 KB · Views: 161
The current wave structure that I am labeling as w.4 is still unfolding. Today's large advance represents w.c of w.b circle. My expectation for the ON session or tomorrow's early trade is a slight advance followed by a partial retracement of the rally that ensued from 1172.25. The optimal retracement level is a .618, which is the most common retracement for each wave of a triangle. I'll post that level once I am certain that the current w.b circle had ended.

From a trading perspective, I actually prefer the triangle over a flat interpretation as a triangle gives a trader the added confidence in knowing that the structure only occurs before the final wave of an impulsive wave (either in a wave B or wave 4 postion). Currently, that's my fourth wave interpretation. So basically, should this interpretation play out, nobody is going to be wondering how high prices can go thereafter as the triangle signals that an end to the rally is near and calculating termination points for w.5 are relatively simple.

I've attached a chart that I presented before depicting moving average compression. Look to the far right side of the chart. Notice how the three moving averages : 30, 10 and MOAD are still compressing as indicated by the blue circle! I think this techincally argues more for the triangle interpretation ratther than the flat interpretaion. However one should note that price always has the final say.


Here's the market's position at the close:

Cyclic Momentum: Weekly is neutral. Daily is bullish. 60 min. is OB.

Pattern: Either a triangle or flat correction for w.4

Time: 4 bars from high to high during the current corrective triangle w.4.


Trade Strategy: Remain flat until w.4 wave pattern becomes clearer. There are times to be aggressive and times to let a wave pattern play out before taking a position. This would be the time to adopt the latter and wait until one of the interpretations can be eliminated. I think we'll have our answer by the end of the week.


Best of Trading
 

Attachments

  • ES_60.gif
    ES_60.gif
    31.9 KB · Views: 190
  • compression of markets.gif
    compression of markets.gif
    28.3 KB · Views: 194
Insight:

The ES-F and $SPX continues to unfold in what I believe is w.4. Friday's advance was interesting as it eliminated the regular triangle interpretation that I was working as my operative wave count. The minor breach of the high that was made on 11/9/2010 (1124.75) also eliminated the regular flat interpretation, leaving Elliotticians with three possibilities.

Elliott Wave Analysis:
As of the close of Friday's session, the following interpretations remain that attempt to describe price movement.


  1. Expanded flat
  2. Running Triangle
  3. W. 4 completed and w.5 is developing

Some readers may argue that in highly leveraged markets, a minor break doesn't negate the regular flat correction. I'm inclined to disagree. Both the ES_F and $SPX made new highs! The rules of EW also dictate otherwise. In my experience placing emphasis upon a wave count that violates a rule almost certainly proves incorrect as more data is added to the right side of the chart.


Attached are the charts for each interpretation including the their wave labeling. With regard to all three charts, my short term bias is higher, possibly to the 1.272 - 1.382 RF (1239-45) for interpretations 1 and 2. Should trade advance beyond these levels, the w.5 interpretation is more likely. Please note that as of this writing, I'm not placing a high probability on the w.5 interpretation because the guideline of alternation would not be met. W.2 unfolded in a sharp correction and therefore the technician should be looking for a sideways correction in w.4. To conclude that w.4 had ended at 1171 would mean that both w.2 and w.4 unfolded in a sharp corrective manner.


Here's the market's position at the close of Friday's trade:


Cyclic Momentum: Weekly is slightly bullish. Daily is bullish and OB. 60 min. is bullish and at the verge of OB.


Pattern: Either a running triangle or expanded flat correction for w.4


Time: no analysis made


Trade Strategy: A top is near but I prefer to remain flat until w.4 wave pattern becomes clearer. There are times to be aggressive and times to let a wave pattern play out before taking a position. This would be the time to adopt the latter and wait until one of the interpretations can be eliminated. Should w.4 still be developing there is plenty of time to jump aboard w.5.


Best of Trading
 

Attachments

  • ES_w.gif
    ES_w.gif
    27 KB · Views: 192
  • ES_running triangle.gif
    ES_running triangle.gif
    28.7 KB · Views: 175
  • ES_expanded flat_60.gif
    ES_expanded flat_60.gif
    29.2 KB · Views: 203
  • ES_expanded flat.gif
    ES_expanded flat.gif
    28.6 KB · Views: 211
Insight:

What a zoozer of a day. The ES_F traded in a 5.5 point range and closed within the previous day's range making it an inside day. For tomorrow... be on your toes looking for a possible trend day.

I would like to spend some time speaking about gold since I was preoccupied with it for most of the day and many of my blog readers have shown an interest in my updates on the subject matter. Gold initially looked like it had topped. A potential trade presented itself with a very small amount of capital exposure and the potential for large returns. I was hoping to go short and take advantage of the opportunity but the trade never materialized. Lucky for me ... as a new recovery high was reached. But it really wasn't dumb luck that keep me out of the trade. It was the knowledge of the wave principal and the fact that IF my wave count was correct, (which it wasn't) then the personality of the trade would have developed in a 5 wave decline of greater magnitude. That's not what a saw developing. Those of you who follow my Tweets were aware that I grew cautious and decided to look for further confirmation that indeed a top was in place.

Elliott Wave Analysis:

Given the inside day in the ES_F an the high wave consolidation that transpired today, I'm still looking higher. Nothing else has changed in my forecast and price targets as indicated in my "week in review" that I posted on Sunday within this forum.

With regards to gold, the new recovery high is a game changer. My previous interpretation was that XK_F was working a w.2 corrective pattern. According to EW rules, w.2 can't exceed the origin of w.1 so that interpretation is null and void. So it's time to embrace an alternate count and be nimble.

Looking at the weekly chart, it appears that further upside potential exists targeting the upper channel line. An interim target is 1459.8... a common wave relationship within w.(5). I've also place other upside Fibonacci extensions on the chart but reaching those levels would involve interpreting w. (5) as an extended wave. Currently w(5) is approx. equal to w.(3). So any further advance makes w.(5) an extended wave. Keep in mind that in commodities, fifth wave extensions are common so I'm not surprised that the train kept on going.

I will continue to monitor the wave count in gold and add commentary as warranted.


Best of Trading
 

Attachments

  • Gold_weekly.gif
    Gold_weekly.gif
    26.3 KB · Views: 188
Insight:

The rally in the ES_F appears to have ended, albeit temporarily so. Yesterday's advance to 1235 came within 4 points of the 1.232 RF that I mentioned in my week in review. The subsequent sell off that developed after the first hour of trade was on high volume and therefore a distribution day.

Gold reversed off it's high of 1432.2 and followed through to the downside. The US Dollar rallied but it doesn't exhibit the price action that one would expect of a third wave.

Elliott Wave Analysis


ES_F:
If w.b circle had ended at 1235, then w.c circle should trade to a minimum of 1195-1203 in w.c circle. Both values represent the .50 and .618 retracements respectively. Should the expanded flat interpretation win out, the decline for w.c circle would be well below 1171. A rise above 1235 would raise serious doubt that wave 4 was still in progress. Note: I have labeled the possibility of w.4 ending at 1171, where the operative count is labeled as w.a circle.


Gold ( XK_F): At the daily chart level, gold has either completed in five waves or the decline from 1432.4 is unfolding in a three wave structure as I have depicted on the ALT (alternative count) line. Either interpretation should result in further downside pressure.

US Dollar (DX_F): The rally from 75.23 to 81.44 has so far unfolded in only three waves. That's a corrective structure that implies that the larger downtrend may remain down. I have been working a series of 1-2's and this interpretation is running out of time and price. What I mean by that is that any further decline below critical support negates the interpretation. Also, if the wave structure is truly unfolding in a 3rd of a 3rd wave, then this rally should be much stronger than what I have observed since the bottom was put in. Bottom line, I'm not giving this interpretation much more latitude and admit that I may be wrong.


Best of Trading
 

Attachments

  • ES_F.gif
    ES_F.gif
    29.5 KB · Views: 200
  • Gold.gif
    Gold.gif
    28.5 KB · Views: 190
  • Dollar.gif
    Dollar.gif
    40.6 KB · Views: 233
Is Santa Claus Or The Grinch Coming To Town?

So far it looks like Santa Claus is coming but the Grinch is lurking. December is historically a good month for stocks and this week was no exception. Investors and traders alike wasted no time waiting for the Santa Claus rally.... they placed bets that the prospect of an extension of the Bush tax cuts would create bullish enthusiasm and drive the major indexes and commodities north. ES_F is up 3% for the month in just eight trading days. Quit impressive! Yes, if you are part of the herd blindly chasing returns.

It's easy to become fixated on the market you trade when you're making money. The reality is that danger and the Grinch is lurking around every corner of the globe. You just have to look at allot of charts to know where to find him hiding. The Grinch who stole Christmas from the Whoos left them with nothing. So will be the same for weak investors who are late to this rally. They will be the first casualties when the Bear market selling resumes. With each and every minor retracement being bought ... a nest of stops awaits the Grinch to set aflame.

As the market heads into the final weeks of December, several market internals confirm the giddiness that I speak of. The attached chart of the $SPX shows that the MS UPDV_Oscillator 25 (NYSE Advance/Decline Volume Oscillator ( 25 day ave)), 5-day NYSE AD/DEC Ratio, and the 5 day NYSE New High/New Lows. The AAII poll of individual investors has reached a level of bullishness that is greater than levels at previous market peaks and the Dow has failed to confirm the rally. Each of these indicators and non confirmation presents a warning to those that are watching intently for the Grinch.

Bottom line: Prices have risen but fewer stocks have the strength necessary to sustain the rally. Today China announced that inflation surged to a 28-month high of 5.1 percent in November. On Friday China's central bank increased the amount of money that lenders must keep on reserve for the third time in one month, a preemptive move to rein in inflation. Should China raise interest rates, US markets and more specifically commodities could be adversely affected.


Elliott Wave Analysis


The advance in ES_F casts serious doubt into whether w.4 of w.(C) of w.b of w.(2) is the operative wave count. I've mentioned that the upside limit to hold onto the expanded flat correction is the area surrounding the 1.272 ans 1.386 RF extensions; 1238.5 and 1244.25 respectively. Whether these price points are breached or not doesn't take away the possibility that w.5 is underway and that w.4 actually ended at 1171. Although I can't know for sure which interpretation is correct, the chart of the ES-F now depicts a w.5 interpretation. Hopefully on Monday we will be able to resolve the wave count as more of the subdivisions of will be in place. In the meantime, common upside targets for the termination of w.5 have been placed on the chart. I will narrow the range and discuss them as soon as possible.


Best of Trading
 

Attachments

  • ES_F.gif
    ES_F.gif
    28.1 KB · Views: 217
  • Market comparison.gif
    Market comparison.gif
    18.7 KB · Views: 212
  • Market internals.gif
    Market internals.gif
    28.4 KB · Views: 203
Today's continuation of the rally fizzled once again. By the close, the ES_F, NQ_F and YM_F could not hold onto their gains to create a new closing high. Market internals continue to weaken. At the daily chart level, the ES_F came within 2 points of the 1.382 RF extension of w.4. As you know this level was cited as a level of significance. Today's high fulfilled the minimal conditions for a w.5 termination. However, looking at the lower 120 min. time frame, the wave structure implies that w.iii either ended on 12/13/10 or today. If the operative wave count is correct, i.e. as I have the chart labeled, then w.iv should end at 1233.75. Thereafter a final push to 1245-1247 should complete the structure for minor w.2. Tomorrow should interesting.
 

Attachments

  • ES_F_daily.gif
    ES_F_daily.gif
    28 KB · Views: 196
  • ES_F_120.gif
    ES_F_120.gif
    26.2 KB · Views: 190
On 12/13/2010 I wrote; "At the daily chart level, the ES_F came within 2 points of the 1.382 RF extension of w.4. As you know this level was cited as a level of significance. Today's high fulfilled the minimal conditions for a w.5 termination. However, looking at the lower 120 min. time frame, the wave structure implies that w.iii either ended on 12/13/10 or today. If the operative wave count is correct, i.e. as I have the chart labeled, then w.iv should end at 1233.75. Thereafter a final push to 1245-1247 should complete the structure for minor w.2. "

On Tuesday the ES_F barely managed to eke out an intraday high but failed to reach my upside targets. Regardless, the move fulfilled the requirement of completing the wave count. The subsequent price action and the lower close as well as today's trade may be the start of something big.

One should take note that the wave pattern from the 1016 has it's flaws. (See first chart - although most of w.(A) isn't shown). For example, w.(A) is much larger than w.(C). Secondly, w.5 of w. (C) is very short. Notice the level of 1306.25. This would be a more typical termination point. whereas w.5 = .618 {(w.1-w.3)}. So caution is still warranted here. I propose that readers keep a watchful eye on the following:


A decline below 1171 would negate any thought that there was more upside potential to this rally.
What if Tuesday's high was only w.1 of an extended w.5? That would imply a decline to the 1198 region, a .618 retracement of w.4. Should price turn up impulsively from there COUNT on a new recovery high.
Near term I believe that a decline is underway and should travel to at least the previous fourth w.iv circle (1219).


Here's the market's position at the close:

Momentum: Weekly and Daily are OB. 60 min is OS and turning up.

Pattern: W.(2) has completed or w.5 of w.(2) is unfolding.

Time: No analysis was made

Trade Strategy: The initial decline doesn't look impulsive at the moment. Wait for additional data points and wave structure clarity before acting. If this is really the beginning of a w.(3) decline, readers will have ample opportunity to ride an extended wave upon any minor intraday retracement.


Best of Trading
 

Attachments

  • ES_F_Daily.gif
    ES_F_Daily.gif
    31.2 KB · Views: 187
  • ES_F_120.gif
    ES_F_120.gif
    26.9 KB · Views: 194
ANNOUNCEMENTS


The market is closed tomorrow in observance of the Christmas holiday. This will be my last post of the week but I'll be back at my desk on December 26, 2010. To all my readers across the globe celebrating either Christmas or Hanuka, I wish you and your family a joyous holiday season.


Elliott Wave Analysis

There isn't much to discuss as trade surrounding the Christmas season is typically dull. Volume is null as most larger traders are in full holiday mode. The ES_F market is putting the finishing touches on the w.5 of the w.(2) advance.

Another sign of a top is the chart of the $SPX (above) that shows the divergence that is occurring as price makes new highs while momentum fails to confirm price. This signature, although not required, is often found with a topping market.

One thing that caught my eye was the most recent decline of COT Commercials positions (not shown). Previously commercials were adding to their positions throughout this rally. Possibly this is just position squaring or is it a "tell" as the seasonal trend for equities ends in mid January. I'll be watching this data carefully.


Best of Trading
 

Attachments

  • ES_F.gif
    ES_F.gif
    28.2 KB · Views: 185
  • $SPX_divergence.gif
    $SPX_divergence.gif
    29.2 KB · Views: 167
Tonight's post will be brief as there is not much to discuss due to the thinly traded holiday markets.Today's price action looks to have completed a small fourth wave which means that a final fifth wave should still unfold to complete w.v circle of w.5 of w. (2). In preparation for the termination of w.(2), I'm looking at the following price targets whereas,


  • w.v circle of w.5 = 1.618 RF of w.4 at 1258
  • w.v circle of w.5 = .618 {w.i-w.iii} at 1271.50
  • w.v circle of w.5 = w.1 at 1291.75

There is one more upside target at 1306.25 where w.v circle of w.5 = .618{w.1-w.3} but the current wave count appears to be to advanced for such a push.


Best of Trading
 

Attachments

  • ES_F.gif
    ES_F.gif
    31.3 KB · Views: 174
Tonight's post will be brief as there is not much to discuss due to the thinly traded holiday markets.Today's price action looks to have completed a small fourth wave which means that a final fifth wave should still unfold to complete w.v circle of w.5 of w. (2). In preparation for the termination of w.(2), I'm looking at the following price targets whereas,


  • w.v circle of w.5 = 1.618 RF of w.4 at 1258
  • w.v circle of w.5 = .618 {w.i-w.iii} at 1271.50
  • w.v circle of w.5 = w.1 at 1291.75

There is one more upside target at 1306.25 where w.v circle of w.5 = .618{w.1-w.3} but the current wave count appears to be to advanced for such a push.


Best of Trading

Very good analysis EWT. I have about the same thing on the EUR_USD and the DJIA. I think the end of the correction is coming soon and it will surprise a lot of people. Right now the amount of bulls in the stock market is almost 95%. That is a good good sign of overbought conditions.

Good Trading,

JahDave

Thanks for the comments.
 
Top