E-mini S&P Elliott Wave Discussion

I have gold and oil as being in a wave two right now, but Tuesday I was talking to a trader friend of mine and I told him that I thought gold and oil had put in highs, silver did not look like it. Then I checked charts and saw that silver had made a new high today. Wow,,,,,,Elliott Wave works,,,,,,but R.N. Elliott himself said that EWT can not predict time or size of moves, only that patterns repeat. I personally use technical indicators to validate my wave counts. I use 5 different things and if they don't line up then I don't trade 95% of the time.......I would not trade any U.S. Indexes at this time.............but I think I would go short at the 12360 without any technical confirmation because I believe strongly in this. I will say again that I only trade my own work and in my own way. Good, bad or indifferent I always accept full responsibility for my trades and my opinion is that every trader should feel this strongly about trading their own analysis as well. In my opinion the bottom line is that every trader should educate themselves and develop and trade their own systems. I think you are the second best technician on this site EWT..........(Of course I'm first......LOL)......You are a great technician and I am sure you will do great things in the markets.

Good Trading,
JahDave

Thanks for the comments. Can you PM me you charts of gold and oil? We can compare counts.
 

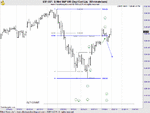
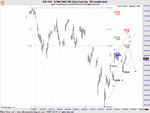
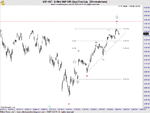
The last time I spoke to readers, I offered an operative and alternative wave count. At the conclusion of today's trade, I can eliminate the alternative wave count as price advanced beyond the 1.618 RF of wave b circle.

That being said, the strength of today's move was a bit of a surprise, as price exceeded my upside target of
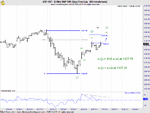
1323.75 - 1325.5 and advanced to 1329 before making a minor three wave decline. The next area of resistance above the is 1332.25. You should note that I have made some changes to the wave count for w.ii circle based upon today's price action. I've labeled the advance as a double three where w.(y) of w.ii circle may have terminated today and if so we should see an immediate decline in five waves if this count is correct.

Notice the Detrend Osc. has a established trendline and diverged as price made new highs. This suggests that the rally is very mature in it's structure or it had already completed it's advance.

If w.ii circle has been struck, then the osc. should fall. Should it push higher and test the trendline during the ON session or tomorrow's trade, price should move higher to where w.(y) = w.(w) at 1337.25. If this scenario prevails, then the rules of EWP apply, in that w.ii circle can't carry beyond the origin of w.i circle if the wave count is correct. Therefore, I'm setting critical resistance at 1343. A print above 1343 negates either wave interpretation.


I hope you found this information helpful.

Best of Trading
 

Attachments

  • ES_F.gif
    ES_F.gif
    31.2 KB · Views: 151
  • ES_F1.gif
    ES_F1.gif
    31.9 KB · Views: 138
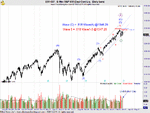
In this weeks edition of "Heard on The Street", I laid out a bullish and bearish forecast for the S&P with the expectation that the index would have to fall hard today in order to maintain my bearish stance.

After the opening bell, the market quickly turned tail and sold off on higher volume. That's another distribution day where institutions were selling. The lower boundary of the Elliott Channel also gave way bolstering the bearish case. This was what I wanted to see and is typical of third wave price action.

The clearest wave structure can be seen in the S&P cash, rather than the E-minis. A series of 1-2's has developed but I would like to see a further decline whereas price breaks critical support at 1294.26 or 1292.5, the equivalent in the ES-F. Until then, the alternative count remains viable. Likewise a break above critical resistance at 1332.28 or 1332.50 in the ES-F, would signal that the alternative count would become the preferred wave count and that price would make a new recovery high above 1343.

I hope you found this information helpful.

Best of Trading
 

Attachments

  • SP1.gif
    SP1.gif
    48.4 KB · Views: 159
  • SP.gif
    SP.gif
    28.8 KB · Views: 149
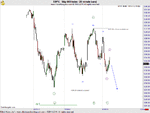
The Market continues to rally to the upside against the decline from 1343.25 - 1243.25. From 1243.25, there are several waves that overlap giving the appearance of a countertrend move.... a W-X-Y double zig-zag. For tomorrow, I'm looking for a further price advance to 1304.50 -1305 where w.c of w.y =w.a. Also note that the lower end of the gap will act as structural resistance. Should the market push through these key areas, then the next zone of resistance is where w.y = w.w at 1312.5.

Failure to penetrate 1296.50 would call into question the immediate wave interpretation and open the door for a retest of 1279 possibly lower to 1268-1270.75.

Since the jury is still out on whether the decline from 1343.25 - 1243.25 is just a correction, I'm focusing only on the current wave structure. Depending on your view of the market, one could also argue that the rally form 1243.25 is a leading diagonal. Regardless of which view is correct, the outlook for the market once the rally completes is still to the downside. The only difference is by how much.

Tomorrow will bring with it another piece of the puzzle. Let's see what develops.


Best of Trading
 

Attachments

  • ES_F.gif
    ES_F.gif
    41 KB · Views: 155
The wave pattern in the e-mini S&P's is still not resolved but the bearish view appears to be in trouble as time and price relationships must quickly be met or the bulls remain in control of this market.

View my bullish and bearish wave counts as well as an update on the EURO-USD in this weeks video edition of Heard On The Street at: http://elliottwavelive.blogspot.com/2011/03/heard-on-street_27.html


Best of Trading
 
Top