EWT
Active member
- Messages
- 170
- Likes
- 0
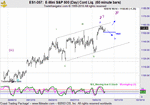
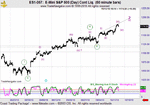
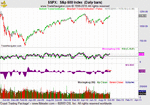
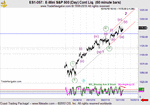
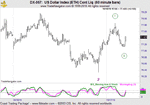
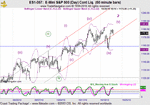
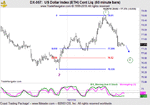
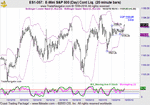
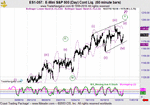
In my daily commentary from Monday, I stated that if a larger degree w.3 was unfolding, then price MUST break through the bottom channel trendline in an impulsive manner. Conversely, a break of the upper channel line and a close above 1144 would indicate that the decline from 1153.5 was just part of a larger w.iv correction and we can expect new highs with limited upside potential. That analysis should have benefited buyside traders. However, two days later and there has been no further follow through to the upside after Tuesday's advance.
Here's the Market's position at the close.
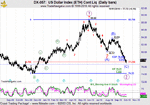
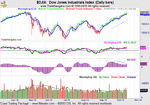
Momentum: Remains OB on weekly and daily time frames.
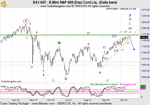
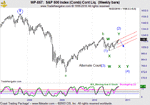
Pattern: W.iv of w.v of w. (v) of w. C of w.2 or 1-2, 1-2 count of w.3. The higher probability being a corrective structure.
Time: Looking at the weekly chart level, H-H time relationships indicate that momentum highs range between 6-8 weeks +/- 1 week. That indicates that the top of wave 2 should occur at the end of this week or the week ending 10/15/2010. In addition, L-H time relationships of 4-5 weeks indicate that a significant top should occur at the end of this week +/- 1week.
Trade Strategy: With weekly and daily momentum OB, there is limited upside potential as the wave structure is mature. There is greater risk trading long at this point. One trade that I'll be looking at is a break of 1151. My reasoning is that a break below this swing low opens the door for an w.iv A-B-C correction and possibly something larger if the wave pattern proves itself as minor w.3 down.
Look for my Twitter updates and follow this trade as well as others in real time.
Best of Trading

