You are using an out of date browser. It may not display this or other websites correctly.
You should upgrade or use an alternative browser.
You should upgrade or use an alternative browser.
tradesmart
Experienced member
- Messages
- 1,286
- Likes
- 22
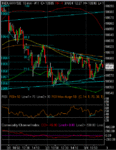
Definitely some meaningful geometry on the 10min chart – a loosely formed triangle perhaps…?
Seems to suggest that the index is winding up to make a break from the range and a possible foray into the 600’s later?……but I’m an optimist, pessimists may have other ideas………! 😕
Seems to suggest that the index is winding up to make a break from the range and a possible foray into the 600’s later?……but I’m an optimist, pessimists may have other ideas………! 😕
Attachments
frugi
1
- Messages
- 1,843
- Likes
- 133
Just a silly question really. I've noticed a lot of folk on here talking of the market going up as a good thing and down as a bad one. Surely as traders you don't care either way, unless of course you have long term equity investments?
I must admit to a having a slight subconscious short bias, the root of which I do not understand. Perhaps it is because sell offs tend to be faster and don't tax my patience as much. Mind you, a bear market rally can be a frighteningly fast creature as well. But I undoubtedly find myself shorting tops more often than buying bottoms and this is something I should address. Odd 🙂
I must admit to a having a slight subconscious short bias, the root of which I do not understand. Perhaps it is because sell offs tend to be faster and don't tax my patience as much. Mind you, a bear market rally can be a frighteningly fast creature as well. But I undoubtedly find myself shorting tops more often than buying bottoms and this is something I should address. Odd 🙂
tradesmart
Experienced member
- Messages
- 1,286
- Likes
- 22
The Wall Street Way:-
If it doesn't go up, then it will go down.
Sounds a little silly, but sometimes that's all it takes to move the market.
Wall Street traders make their living by figuring out which side is most vulnerable and attacking it, regardless of underlying reasons.
Not all traders are as smart as they dress, but many are pretty savvy. And the ones who last are flexible -- they can change their minds after just one trade. If buying stops working, then the Street will take a shot at the downside.
If the fundamentals are on their side, all the better. But traders can always spin the reasons to fit what they are doing -- it's called "talking your book" -- so they can apply an intellectual reason to their trading decisions, instead of just a silly phrase.
so maybe the moral is - if you can't beat 'em, join 'em....... 😉
Frugi, that reminds me of myself a few months ago, when I just couldn't go long, always looking to short. My main reason for that was that I paid too much attention to all the Guru's out there who were expecting the market to collapse any moment. Unsurprisingly I never made any money and would hang on to loosers even when obvious.
Thankfully paying more attention to CM's work and other valued contributors on this board has helped me turn the tide.
Thankfully paying more attention to CM's work and other valued contributors on this board has helped me turn the tide.
tradesmart
Experienced member
- Messages
- 1,286
- Likes
- 22
anmol - with the NFPR data tomorrow, and the Intel update after the close, maybe 'buying the rumour' will continue to the bell....?
plenty of opportunities to 'sell the fact' tomorrow......
not taking anything for granted, but watching closely....... 😎
edit 20.49 - Dow traders selling the fact a bit early...? 😡 a lead balloon today compared with the Naz & S&P
plenty of opportunities to 'sell the fact' tomorrow......
not taking anything for granted, but watching closely....... 😎
edit 20.49 - Dow traders selling the fact a bit early...? 😡 a lead balloon today compared with the Naz & S&P
Last edited:
It seems like yesterday and today the expected moves have faltered. With hindsight, yesterday whereas the market was moving up sox didn't follow suit, and today the banking index, bkx palyed its part in keeping the move under tabs.
Maybe nonsense, but I suppose we need to have the main indices all in the same direction for a good move.
Maybe nonsense, but I suppose we need to have the main indices all in the same direction for a good move.
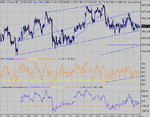
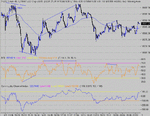
Just a quicky...short as res test fails, and a cover on PD bottom, along with ES vol div and a failure to break 64.
Stretched PD top, with 10 point pull backs shouldn't have been too difficult to track... Taking the D top at 95 was only 5 off the top...
Stretched PD top, with 10 point pull backs shouldn't have been too difficult to track... Taking the D top at 95 was only 5 off the top...
Attachments
tradesmart
Experienced member
- Messages
- 1,286
- Likes
- 22
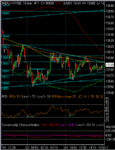
The Dow stubbornly refused to break out of it’s tightening range within the triangle yesterday, so it’s almost a dead cert that a big move will occur today under pressure of reaction to the NFPR numbers………
The triangle height suggests the possibility of 70 points up or down, but plainly it could be a very nice tradeable move out of the tight range…….. 😀
The triangle height suggests the possibility of 70 points up or down, but plainly it could be a very nice tradeable move out of the tight range…….. 😀
Attachments
tradesmart
Experienced member
- Messages
- 1,286
- Likes
- 22
Mom - I'll be watching for some kind of 'fake' move before the true direction kicks in - they seem to regularly play it like that.... 😕
or maybe they'll find something new today ......?
anyway, look on the bright side, we've got 6-1/2 hours trading time to hopefully pick up a few points.......... :cheesy:
or maybe they'll find something new today ......?
anyway, look on the bright side, we've got 6-1/2 hours trading time to hopefully pick up a few points.......... :cheesy:
tradesmart....
"look onthe bright side e have 6+hrs to pick up a few pts"
excellent !! was i glad to read that positive "affirmation" re assurrance etc.. i can wind myself up trying to be perfect and call every trade..who cares?! where's the competition? who am i trying to beat? what have i to prove?
enjoy the work? not a bad idea... relax? very good idea..
remind myself that if i'm patient i'll pick up some points even if i only wait for 2 or 3 ND/PD's,.....and that i have 6+hrs to do it in? Excellent idea!!!
question: i know some pro's look to achieve X no' of pts each day then close their book for the day.. do you? [i see you trade in shifts--early p.m. then the "evening shift"] do you have a set target or does that not work for you? it does stop over trading but it can pressure you into reaching a target! if you feel it's okay to answer then i look foreward to that..
thank you...and esp: for all your posts.
One Eyed Shark
Well-known member
- Messages
- 257
- Likes
- 13
Folks
While it is quiet and we are waiting for figures I thought I would pick your collective brains.
Always looking to simplify my trading, I have been looking at an indicator by Jan Arps that plots positive and negative divergance directly onto the price screen via a series of dots hence removing the need to run with the indicator below the price window.
The issue being that he has a slightly different take on PD/ND as us and although I initially discounted it, one or two setups have been confirmed and I would like to canvass your opinions.
The only thing I need to point out is that this divergance applies to a Fast stoch, although my understanding is divergance on a momentum indicator (I use MACD extensively at the mo) does not differ from div on RSI.
The non contentious issue is that a Bull Pivot is created with decreasing price and two troughs with the second being higher (PD) and a Bear Pivot with increasing price and two peaks the second being lower (ND), I take it this is our collective understanding.
The contentious issue is what he calls Bull Trend Change and Bear Trend Change, the difference being a Bull Trend Change occurs when price increase against two troughs the second being the lower effectively giving us ND and Bear Trend Change coming with lower price and two peaks the second being the higher i.e. giving us PD.
He gives a lot more weight to the "Trend Change" although they are contrary to what I classify as ND/PD.
Therefore the quetion is, does it make any difference when looking at PD/ND whether we are comparing peaks or troughs i.e. coming from an overbought to an oversold position.
My initial reaction was to discount this but one or two setups have provided confirmation, though as ever I still have to find something that works 100% of the time 😀
Attachments
Similar threads
- Replies
- 1
- Views
- 2K


