firewalker99
Legendary member
- Messages
- 6,655
- Likes
- 613
in for a short
at 570 then?
in for a short
Am I correct to say the support is at 580 for a short TF and 540 for a longer one? And resistance is at 620? Sorry for all the questions.
at 570 then?
The way I see it (but that doesn't necessarily mean that's correct, let alone that this is the only way), support is at 460, 540, 590. Resistance 590 (not that we broken below it), 640, 690.
1365.4 S&P which is equivalent I guess
Oh.. at least I got one right~~ LOL...Thank you~~ I shall wait patiently for these~~
Now, there's the coach! Ok matey! What you up to?
The way I see it (but that doesn't necessarily mean that's correct, let alone that this is the only way), support is at 460, 540, 590. Resistance 590 (not that we broken below it), 640, 690.
Keep in mind those numbers aren't 'fixed'. I tend to give them some space +/- 10 points. Like just now, price is reacting off 12547. I'm not saying you should go long here (unless that's what your plan tells you to do).
a piccie to show the support levels would not go amiss expecially the 460 one...
cheers fw
I'm going over the parapet with the rest of them if this trades down through 20s
Might be faked out but hey when a levels this big you gotta trade it right?
My plan is to wait for a big move sometime this week. My graph shows that we have been moving side way for about 5 to 6 days. In the graph everytime this happens, there will be a day with a big dip or spike. But I may be very wrong here.....
the 540 is probably obvious...
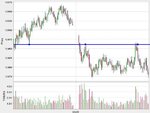
The 460 is just a line in the sand really, it's not guaranteed, but it's all I can see between here and 400. It comes from the 26 and 27th or March (see chart). One can hardly expect this to plunge straight away to 400 (although you never know).
t_d, what's your on the next potential support?
Oil NOW looking interesting... if you can handle the volatility
Don't try this at home........................
Crude Oil Chart
observe the effort buyers are making to stay above the 12540 level...
observe the effort buyers are making to stay above the 12540 level...