You are using an out of date browser. It may not display this or other websites correctly.
You should upgrade or use an alternative browser.
You should upgrade or use an alternative browser.
firewalker99
Legendary member
- Messages
- 6,655
- Likes
- 613
firewalker99 said:12700 was worth a short today that's for sure 🙂
I hope you guys noticed that my post was at 5:09 pm local time, which means YM was at that time only open for 90 minutes and had only moved lower 30 points.
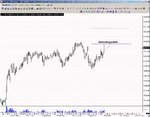
This has got to be one of my best trades ever... I shorted at the red dot and exited first half at the first blue dot and scaled out the rest at the second blue dot... only thing I had to do was see if it broke my line... I can think of worse ways to start the weekend :cheesy:
Attachments
andycan
Established member
- Messages
- 630
- Likes
- 28
BezBez said:Its sure was 🙂
Stunning pattern this morning on the ES & SPX that Andycan would of no doubt nailed 😎
Running Alt....
It was a sweet trade, lovely flowing geometry, crystal clear
i hope you guys enjoyed the ride
well done firewalker you were on the button on that one!
Mr_Stochastyk
Junior member
- Messages
- 20
- Likes
- 0
Am I missing something?
I do not quite understand what makes you so excited ..if my maths is right you made just about 1% or even below if we count commission costs..
Btw. If you'd traded QQQQ on Friday you would have made an easy 2% ...
Yeah, I know, the volatility is low..but, still... Also, if I were you, I wouldn't close my short position yet. I think they will continue to move lower next week.
Good trades,
Andre
firewalker99 said:I hope you guys noticed that my post was at 5:09 pm local time, which means YM was at that time only open for 90 minutes and had only moved lower 30 points.
This has got to be one of my best trades ever... I shorted at the red dot and exited first half at the first blue dot and scaled out the rest at the second blue dot... only thing I had to do was see if it broke my line... I can think of worse ways to start the weekend :cheesy:
I do not quite understand what makes you so excited ..if my maths is right you made just about 1% or even below if we count commission costs..
Btw. If you'd traded QQQQ on Friday you would have made an easy 2% ...
Yeah, I know, the volatility is low..but, still... Also, if I were you, I wouldn't close my short position yet. I think they will continue to move lower next week.
Good trades,
Andre
Atilla
Legendary member
- Messages
- 21,035
- Likes
- 4,206
View from November 2006
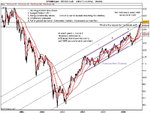
This beginners chart dating back to 24th of November I've been watching very carefuly and I feel is still in play.
I was very bearish just before Christmas and was shocked the market lurched forward past 1410 on the S&P500. Using the Standard Error Channel I was expecting resistance at 1450 and I think we may be seeing it.
Based on Fib retracements that didn't happen I'm now expecting a fall to 1315-1350 levels.
The big sell off everyone was talking about I feel is about to happen.
I can't see the Dow doing much else but fall to 11700 regions either.
Unless ofcourse the PPT kicks in and we go all the way to 1500 and 12700 respectively.
I'm listening, watching and waiting... :arrowd:
Attachments
firewalker99
Legendary member
- Messages
- 6,655
- Likes
- 613
Mr_Stochastyk said:I do not quite understand what makes you so excited ..if my maths is right you made just about 1% or even below if we count commission costs..
Btw. If you'd traded QQQQ on Friday you would have made an easy 2% ...
Yeah, I know, the volatility is low..but, still... Also, if I were you, I wouldn't close my short position yet. I think they will continue to move lower next week.
Good trades,
Andre
Hi, I agree it is likely we will be seeing lower prices next week (starting tomorrow), but I don't hold overnight positions...
Now about your maths 😕 this is how I see it:
- short at 12690 with a stop above my line (it actually was at 12710)
- one half of your position exit at 12620 => 70 points
- other half of your position exit at 12600 => 90 points
This means my risk was limited to 20 points per contract, and I made 70 + 90 points = 160 points if I would have traded only two lots. That is a risk:reward of 1:4... I'm sure everybody here will be very interested indeed if you have something better to show that's possible on a daily basis by making only intraday transactions 🙂
About that 1%... Margin on YM is 1219 USD with tick size 5 USD.
Suppose I traded 2 lots I would have made 160 points x 5 USD = 800 USD.
That's 800 USD out of 1219x2 = 2438USD or a whopping 32,81% profit on that single (one and only) trade of the day.
Now, let's assume for the sake of things that I never risked more than 5% of your account size on any single trade. A risk of 20 points x 5 USD = 100USD = 5% means the minimum account size would have to be 2000USD per lot.
So... anybody who had 4000 USD in their account size, would have made on this trade 800USD by risking only 5% and gaining 20% net ... In one day... can you see why I felt good about it? 😀
firewalker99
Legendary member
- Messages
- 6,655
- Likes
- 613
Atilla said:This beginners chart dating back to 24th of November I've been watching very carefuly and I feel is still in play.
I was very bearish just before Christmas and was shocked the market lurched forward past 1410 on the S&P500. Using the Standard Error Channel I was expecting resistance at 1450 and I think we may be seeing it.
Based on Fib retracements that didn't happen I'm now expecting a fall to 1315-1350 levels.
The big sell off everyone was talking about I feel is about to happen.
I can't see the Dow doing much else but fall to 11700 regions either.
Unless ofcourse the PPT kicks in and we go all the way to 1500 and 12700 respectively.
I'm listening, watching and waiting... :arrowd:
You mention "why this breakout" on the chart. Why is of little relevance if that breakouts fails and we reverse from there. Often near trend climax (exhaustion), we can see a vertical rise in price but which is unsustainable...
I also noticed you are writing down elements to sustain a potential bearish viewpoint. That's not bad, but be aware that the more you look for those elements the more you will see them and help you confirm your opinion or bias... :idea: It's my belief that not the economic indicators but the market itself gives us clues about economy itself...
Atilla
Legendary member
- Messages
- 21,035
- Likes
- 4,206
firewalker99 said:You mention "why this breakout" on the chart. Why is of little relevance if that breakouts fails and we reverse from there. Often near trend climax (exhaustion), we can see a vertical rise in price but which is unsustainable...
I also noticed you are writing down elements to sustain a potential bearish viewpoint. That's not bad, but be aware that the more you look for those elements the more you will see them and help you confirm your opinion or bias... :idea: It's my belief that not the economic indicators but the market itself gives us clues about economy itself...
I haven't seen any good news and the news I do see is still bad. We may be having a soft landing in housing starts but I'm not convinced. Inflationary pressures still in the economy and Fed sounding hawkish. Elections coming up and people talking of tax cuts can only add to inflationary pressures.
ECB hawkish on interest rates. BoE manipulating inflationary figures by removing fuel and energy from CPI to bring it down from 3.8% to 1.2% with another interest rate increase potentially on the way.
I'm not sure about about economic indicators. To me the price is like the pulse on the body. It gives one an indication about the health of a patient. FA is the body and TA is the pulse. TA reflects FA not the other way round imo. I'm aware there are many TAs here who'd disagree.
Leaving the news and FA out of the equation, the TA to me says 20% increase (S&P500) in the last 8 months without a decent correction spells over extension. The 30/40 week cycle is about to kick in which spells an expected and overdue downturn in my calculations.
Atilla
Legendary member
- Messages
- 21,035
- Likes
- 4,206
Bez said:I Still carn't rule this out.....
🙂
You may / are probably right. Starting from around week 24 of June the S&P has risen without a decent correction. 8th March takes it up to 38/9 weeks. Virtually on the nose to 40 weeks then.
I was wrong about 1410. I thought 1450 would be first point of resistance. Assuming 1460 is breached then 1500 levels is a possibility but not a strong one given all the bad news.
40+/- week or 1500 regions and I'll be putting my big £bets on the table.
firewalker99
Legendary member
- Messages
- 6,655
- Likes
- 613
Atilla said:I haven't seen any good news and the news I do see is still bad. We may be having a soft landing in housing starts but I'm not convinced. Inflationary pressures still in the economy and Fed sounding hawkish. Elections coming up and people talking of tax cuts can only add to inflationary pressures.
ECB hawkish on interest rates. BoE manipulating inflationary figures by removing fuel and energy from CPI to bring it down from 3.8% to 1.2% with another interest rate increase potentially on the way.
I'm not sure about about economic indicators. To me the price is like the pulse on the body. It gives one an indication about the health of a patient. FA is the body and TA is the pulse. TA reflects FA not the other way round imo. I'm aware there are many TAs here who'd disagree.
Leaving the news and FA out of the equation, the TA to me says 20% increase (S&P500) in the last 8 months without a decent correction spells over extension. The 30/40 week cycle is about to kick in which spells an expected and overdue downturn in my calculations.
I agree another potential intrest rate increase may be around the corner... although last time we had the FOMC figures the market did react by shooting up more than expected.
"FA is the body and TA is the pulse", nice analogy, but when your pulse is dropping your body might still be feeling okay only for you to become ill later on. But I'm no doctor and for me it doesn't really matter if FA influences TA or vice versa. What I am wary of, is when the market starts to discount good news and fails to react positively to it. That would really be a red flashing light...
Mr_Stochastyk
Junior member
- Messages
- 20
- Likes
- 0
firewalker99 said:Hi, I agree it is likely we will be seeing lower prices next week (starting tomorrow), but I don't hold overnight positions...
About that 1%... Margin on YM is 1219 USD with tick size 5 USD.
Suppose I traded 2 lots I would have made 160 points x 5 USD = 800 USD.
That's 800 USD out of 1219x2 = 2438USD or a whopping 32,81% profit on that single (one and only) trade of the day.
😀
Thanks for explaining the details of your trade. The truth is, I never trade futures. Always thought that the risk was to high (even if the expected returns are high, the weekly variance is somewhat difficult to swallow).
What about liquidity - do you find it easy to open/close small to medium sized positions? What is the mean daily transaction number in the Dow minis?
Andre
firewalker99
Legendary member
- Messages
- 6,655
- Likes
- 613
Mr_Stochastyk said:Thanks for explaining the details of your trade. The truth is, I never trade futures. Always thought that the risk was to high (even if the expected returns are high, the weekly variance is somewhat difficult to swallow).
What about liquidity - do you find it easy to open/close small to medium sized positions? What is the mean daily transaction number in the Dow minis?
Andre
I had a slight hunch that you didn't trade futures to be honest, because that "only 1%" seem to come out of nowhere. Nothing wrong with that, perhaps it even spurred your interest in futures. The risk is only as high as you want it to be. But you know from basic economics that risk and potential reward are two proportional variables.
The risk on any single trade is only as high as you want it to be. If you feel not comfortable risking more than 2% on any single trade, you don't have to. You can trade an instrument with lesser volatility or lesser tick size. YM (=DOW) only has 5USD for tick size.
The dow mini has around 100.000-125.000 lots traded each day, I don't know by heart what the numbers on other e-minis are, but I think you'll find that volume is around 1 million or more on ES! So, liquidity is no issue here 🙂
Which time frame are you intrested in tricks :?:
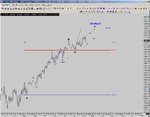
The SPX needs to bust the last delta low point at 1417 to get me to change the count as shown here 🙂
http://www.trade2win.com/boards/showpost.php?p=309322&postcount=229
I'll do some scribbles on the INDU after the close 🙂
The SPX needs to bust the last delta low point at 1417 to get me to change the count as shown here 🙂
http://www.trade2win.com/boards/showpost.php?p=309322&postcount=229
I'll do some scribbles on the INDU after the close 🙂
Bez said:Which time frame are you intrested in tricks :?:
The SPX needs to bust the last delta low point at 1417 to get me to change the count as shown here 🙂
http://www.trade2win.com/boards/showpost.php?p=309322&postcount=229
I'll do some scribbles on the INDU after the close 🙂
Hi Bez,
My time frame is 'expiration of March contract?', and, yes, I'm looking for 1417 SPX to bust (re your analysis) and DOW, which I'm trading, to hit 12325 minimum! And the remaining 10% correction. 😆
cheers - Tricks
Racer said:Another year, another move higher? Or will it be lower? 🙄
Hi Racer,
How are you?
Isn't it time for the Mummy Bear to give some guidance as to the direction? Has the 'picnic' started, or are they still in hibernation?
cheers - Tricks
Mr_Stochastyk
Junior member
- Messages
- 20
- Likes
- 0
firewalker99 said:I had a slight hunch that you didn't trade futures to be honest, because that "only 1%" seem to come out of nowhere. Nothing wrong with that, perhaps it even spurred your interest in futures. [...]
The dow mini has around 100.000-125.000 lots traded each day, I don't know by heart what the numbers on other e-minis are, but I think you'll find that volume is around 1 million or more on ES! So, liquidity is no issue here 🙂
Thanks for the information - I knew about the ES but ignored the existence of the dow mini.
Speaking about spurring interest in futures, I also found this article on the CBOT site:
http://www.cbot.com/cbot/pub/cont_detail/0,3206,1180+26231,00.html
I haven't changed my trading habits yet but it certainly is interesting to watch..
We'll have an interesting day today: I wonder if they can keep the trading range intact - we shall see soon!
good trades,
Andre
Similar threads
- Replies
- 0
- Views
- 2K