Dow 2007

Hook Shot said:
My mistake karmit - I was implying dax strength might rub off on US indices .... perhaps a leading indicator ...... maybe 😕

As for the timing of a big move today ....... maybe I got that one wrong ? .... :cheesy:


One things is for sure...if the DAX pushes on up tomorrow, I'm going to spank it with an unfeasibly small short :cheesy:
 
George W on the floor of the NYSE! Well, well. Is that the PPT in action or what? Ha ha ha.

Giving out 'high fives' as well, what a joke! Is that a coincidence that it just happens to be Fed day?

cheers - Tricks
 
Last edited:
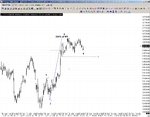
1:30 support 12540 dow 12569 r

triangle should be bullish. Fed speak in 10 minutes est hope chart will attach
Jerry
 

Attachments

  • triangle support dow fed day.gif
    triangle support dow fed day.gif
    86 KB · Views: 157
Hook Shot said:
Bez - you've taught me something ........ will have to find out more about Toby Crable - Thx

Thanks Hook Shot for the kind words & it shows the threads doing its job.... 😎

Well done people on the last few pages of post..There was more than enough good pointers about the risk on being on the short side..
 
Bez said:
Thanks Hook Shot for the kind words & it shows the threads doing its job.... 😎

Well done people on the last few pages of post..There was more than enough good pointers about the risk on being on the short side..

credit where it's due...
Bears the market remains cyclical your time will come :cheesy:
 
About 89

The 161.8% extension is a perfect target for this wave 3 and that comes in around 1498!

I have nothing on the higher Long Term delta frame till May & the Super long isn't due to 2008 so I can't be bearish....

The only outside possibility that is that Super Long Term Delta point did not come in with Last Mays High and could come in in March 07. How ever the odds are on that are in the very low teens ...
 
BEZ- We may as well say New All Time Highs are coming on SPX then..... ? [Purely Conjecture]
Perhaps getting ahead .............. but we're less than 10% .....

Thanks for responding
 
For those who like fractral patterns...

This is a weekly SPX chart focused in on 1999 (8 year) fractral pattern of the seasonal 18 point long term delta time frame.
 

Attachments

  • 8 year fractral.jpg
    8 year fractral.jpg
    189.9 KB · Views: 179
ammo said:
do you know the probability of that addage? 17 of 20? i'm forgetful and curious

"according to the January Barometer, one of the more reliable market indicators around, "as January goes, so goes the year." And January is going well, despite a shaky start.

According to the Stock Trader's Almanac, how the S&P 500 does in January tends to correlate with how the market does for the full year.

Since 1950, the barometer has been right 91 percent of the time, according to the Almanac, or 75 percent of the time when you factor out years that ended essentially flat."

http://money.cnn.com/2007/01/31/markets/markets_january/
 
Just a simple doodle on the INDU to curve fit the shorter term delta as it hinting that we should have a wave 4 low Monday/Tuesday... :?:

Not 100% happy with the start point of the W3 as it could be a running flat would give a slightly higher wave 3 target high but the chart gives the basic idea of the delta direction.
 

Attachments

  • simple indu.jpg
    simple indu.jpg
    195.3 KB · Views: 199
ES feels like its in one of those pesky ED's...

1454 is 161.8% of the Wave i on the chart......
 

Attachments

  • esed2.jpg
    esed2.jpg
    187.1 KB · Views: 198
Bez said:
ES feels like its in one of those pesky ED's...

1454 is 161.8% of the Wave i on the chart......
bez thanks for the charts and analysis,what does ed mean?
 
Like it Hook Shot :cheesy: :cheesy:

Thanks ammo,🙂

ED = Elliott Waves Ending Diaginal pattern, I posted a bit on them on page 19..

http://www.trade2win.com/boards/showthread.php?t=22794&page=19&pp=10

Another good example of one is MER which I put on one of the equities threads, the key as always to spot them is 3 waves down in the first leg, then overlap between waves 4 & 1, that normals nails them, for you to get ready to exit on the finial 5th wave or to start looking to go Long once the 5th wave is complete.. ( On the first MER chart the wave ii is slightly two low, I was trading at the time and just did a rough sketch, the second MER update chart is a more cleaner pattern 😱 )


ES did its expected chop but I need to change the count its evolved in to something slightly different...The INDU faired a little better for the wave 4 🙂
 

Attachments

  • induupdate4.jpg
    induupdate4.jpg
    201.1 KB · Views: 177
  • mered.jpg
    mered.jpg
    197.6 KB · Views: 134
  • meredupdate.jpg
    meredupdate.jpg
    197.9 KB · Views: 164
Last edited:
Bez said:
Just a simple doodle on the INDU to curve fit the shorter term delta as it hinting that we should have a wave 4 low Monday/Tuesday... :?:

Just an up date on that chart, the red line at the lesser W4 low is the usual line in the sand....
 

Attachments

  • induwave4 update.jpg
    induwave4 update.jpg
    205.8 KB · Views: 235
9700 (Low), 10700 (Low), ~11700 (Hi)........... 12700 ?

Dow has now done 2000pts since July lows at 10700 - for what it's worth.
 
Hook Shot said:
9700 (Low), 10700 (Low), ~11700 (Hi)........... 12700 ?

Dow has now done 2000pts since July lows at 10700 - for what it's worth.

12700 was worth a short today that's for sure 🙂
 
Back
Top