Diary of a swing spread better

hungvir said:
That's true.

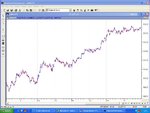
What I mean is the DOW travels down about a third of half of the previous day's bar almost every day. Doesn't it make sense to short it when it moves about 30-50 points above yesterday's high and get out of the trade when it moves down about 30 points from your entry.

If you look at the chart again, the odds are in the shorter's favour.

Best,

Hung

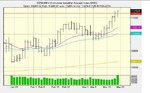
Looking at the Big Chart 10 day Dow, it is rising. When is it going to go down? Are you willing to
try to spot the turn? TA thinking is that it is dangerous to trade against the trend, certainly it is less risky, in my view, to do the reverse i.e. buy when the index is below a certain point of the previous day's bar- where, is up to you. In any case, while you are working on it- 50 pence trades- OK? With low funds, have you considered trading SP500, which is less volatile?

Split
 
I've thought of SP500 but haven't tried it. Thanks for the suggestion.

For shorting the DOW in an up trend, I will try not to have a 'naked' short. By this I mean I'll long the DOW future to catch the big movement upwards but shorting it on a daily basis to catch the daily reversal.
 
don_h said:
Very good point Split.
Heres a chart for you hungvir to illustrate splits advice.

does your new plan still work now on a 15 minute chart?

Thanks for the chart!

I only checked my assumption against daily charts and it works. If it doesn't, the DOW is going to the moon soon enough. Imagin the DOW moving up 50 points each day with no retracements. Then we'll see the DOW at 22,000 by the end of the year.

Even if it goes down 25 points for every 50 point up move, the DOW would end up at around 16,000 in the next 40 weeks. Is this realistic? Why can't we make money shorting it every day?
 
hungvir said:
Even if it goes down 25 points for every 50 point up move, the DOW would end up at around 16,000 in the next 40 weeks. Is this realistic? Why can't we make money shorting it every day?

Good point hungvir I am looking into this now (while keeping in mind splitlinks point of trading with the trend)
swing trading to the short side daily so to speak in an uptrend tough one that we shall see :|
 
hungvir said:
....................... Why can't we make money shorting it every day?.................

hung

:) well you can, if you can pick the daily top - and therein lies the rub :confused:

btw your "no gaps on the dow" is an illusion. The "technical" open at or about the previous close is followed moments later by the "true" opening level which is the one you can trade at.

good trading

jon
 
Hi Jon,

I am just considering what the chart is telling me. And it says: ''Hung, whenever I move up about 30 points from the previous day's high, I'll also move down at least the same amount even if I would end up making higher high later.'' :)

By the way, how did the AZN short serve you?! I am now longing it.

Cheers,

Hung
 
Can anyone look at this chart and not see a chance to make money shorting the DOW? Almost every price bar is a pillow for the next one.
 

Attachments

  • dow 2006.jpg
    dow 2006.jpg
    35.8 KB · Views: 152
hungvir said:
Can anyone look at this chart and not see a chance to make money shorting the DOW? Almost every price bar is a pillow for the next one.


hung

mmm, i'm not so sure about your chart - looks a lot different to mine.

had 2 azn shorts - one worked out but I was caught out by the rocket on the second :(

cheers

jon
 

Attachments

  • untitled.JPG
    untitled.JPG
    34.7 KB · Views: 138
Hi Jon,

Hope your aggregate short worked out OK.

For shorting the DOW, I am going to do a bit of experimenting next week with 10p stake. Will let you know how I fare.

And I know where the difference between the charts lies. Mine doesn't have any candles :)
 
hungvir said:
.............................And I know where the difference between the charts lies. Mine doesn't have any candles :).........................


hung,

oh, alright then!!

it's not just that - if you look at the high low info at the top of the chart you posted the low of the day was 11254. Now look at the bar for the day - that's showing a low point near 11200, can't be right.

jon
 

Attachments

  • DOW.JPG
    DOW.JPG
    43 KB · Views: 160
hungvir said:
Can anyone look at this chart and not see a chance to make money shorting the DOW?

Hi hung
Well no not really if you take on barjons point in an earlier post (325)
not a good idea shorting intraday in an uptrend it would be far better to hitch a ride on the trend as has already been said by others :(
metastock chart this time 8 to 17 march (this shows more upness intraday than downess dont you think)

Do not despair though hung as your plan may work rather well in sideways action on the dow when I can I will post a chart for you to look at :)

keep up your good work and ideas :idea:
 

Attachments

  • metastock dow 5 min chart.jpg
    metastock dow 5 min chart.jpg
    122.2 KB · Views: 154
Last edited:
barjon said:
hung

mmm, i'm not so sure about your chart - looks a lot different to mine.

had 2 azn shorts - one worked out but I was caught out by the rocket on the second :(

cheers

jon

Jon,

Hung's got the bit between his teeth- no stopping him!

Split
 
I'm glad that I'm only in the house for the last half hour of the Dow. it keeps me out of mischief.

BTW, Hung, remember that Greenspan's successor is talking this week, that might make for some speculation.

Split
 
barjon said:
hung,

oh, alright then!!

it's not just that - if you look at the high low info at the top of the chart you posted the low of the day was 11254. Now look at the bar for the day - that's showing a low point near 11200, can't be right.

jon


I see what you mean.

The low and high shown were actually not for last Friday. It was for the day where the cursor was and I don't know what day it was :(
 
Last edited:
Splitlink said:
BTW, Hung, remember that Greenspan's successor is talking this week, that might make for some speculation.

Split

I'll wait to start my experiment after that then.

Good talking to you!
 
hungvir said:
I see what you mean.

The low and high shown were actually not for last Friday. It was for the day where the cursor was and I don't know what day it was :(


mm, i should look at the chart carefully again

jon
 
To be honest, I quite like Sharescope's charting package but I just don't want to pay for anything at the moment.

On the other hand, I used to spend so much time data mining with Sharescope that I did not trade much. It was analysis paralysis for me.
 
don_h said:
Hi hung
Well no not really if you take on barjons point in an earlier post (325)
not a good idea shorting intraday in an uptrend it would be far better to hitch a ride on the trend as has already been said by others :(
metastock chart this time 8 to 17 march (this shows more upness intraday than downess dont you think)

Do not despair though hung as your plan may work rather well in sideways action on the dow when I can I will post a chart for you to look at :)

keep up your good work and ideas :idea:

Thanks, don_h! Let's keep the disco going!

Enjoy the rest of the day!
 
barjon said:
mm, i should look at the chart carefully again

jon

Hi barjon
If you are commenting on hungvirs chart in post 327 I believe he may be right in that its his red cursor line highlighting the price to the right (11253.2)
 
Last edited:
hi don

I was looking at the last bar which was Friday's, I think. The cursor line at 11253 obscures the opening dash on the left hand side of the bar but the bar itself goes down to nearly 11200 when the price on Friday never got below the 11254 open. Doesn't seem to make sense unless I'm missing something.

good trading

jon
 
Top