Diary of a swing spread better

barjon said:
hi don

I was looking at the last bar which was Friday's, I think. The cursor line at 11253 obscures the opening dash on the left hand side of the bar but the bar itself goes down to nearly 11200 when the price on Friday never got below the 11254 open. Doesn't seem to make sense unless I'm missing something.

good trading

jon

Hi Jon
Yes I see that now, agree totally with you about fridays bar,well spotted its low is rather low isnt it so to speak :)

although my friday bar looks the same as yours others on my chart do not , other bars highs and lows appear different to both hungvirs and your chart compared to mine
I use yahoo data for my EOD charts (free) :)
hungvirs data comes from Advfn I believe (free) :)
I believe that free is the problem here if i recall there are posts on T2W somewhere that deal with this issue on free data :(
in your opinion jon would this have much of an impact on hungvirs dow trading? I suppose it must do really if you are basing a strategy on price moves that were never really there :eek:

For the benefit of others interested "DOW Data On Yahoo" can be found in the forum US Indices

http://www.trade2win.com/boards/showthread.php?t=18341


Im now off to compare yahoo data with Quote.com data (if thats any better that is)
 

Attachments

  • DOW EOD USING YAHOO DATA.JPG
    DOW EOD USING YAHOO DATA.JPG
    54.4 KB · Views: 146
Last edited:
Hi Jon and don_h,

Now I have my doubt about ADVFN data. I just double checked and they give 11211 as Friday's low for the DOW.

I'll check other sources. Thanks again for spotting it
 

Attachments

  • dow friday.jpg
    dow friday.jpg
    41.5 KB · Views: 122
Very strange. The one minute chart gives a different figures and the correct one, I think.
 

Attachments

  • dow intra day friday.jpg
    dow intra day friday.jpg
    35.8 KB · Views: 179
hung

Yes, they have all the main indices. You'll find differences between a lot of data providers. Highs for example - some use highest offer, some highest mid-price, some highest trade and so on.

Similar with openings - for example, Sharescope only fairly recently recognised gap openings on FTSE (because they used follow the LSE rules that open=close (ie: taking no account of pre-market auction)). This means you would get very different looking candles depending on how they operate.

jon
 
Good to know this, Jon. Thank you.

I'll have to do a bit more research about the DOW's movement then.
 
hungvir said:
Good to know this, Jon. Thank you.

I'll have to do a bit more research about the DOW's movement then.

hung after some research the only problem with our charts is that the price bars are a bit too long in places thats all . The close is ok (for yahoo) and as such wont affect any indicators running off this data that rely on the closing price as far as I can see, but will affect eyeballing them for potential trading plans and strategies :cry:
As for myself I am happy to use yahoo data for my strategy development for now but will not post any more charts that are derived from them so as not to cause confusion or misrepresentation :eek:
A big thank you to barjon for pointing this data anomaly out to us :D
 
It did leave me with the impression that I can earn money shorting the DOW every up day. Now it's every other up day :)
 
I still don't want to dump my idea that the DOW should move down an X amount of points for every Y amount of points in an upward surge. Will do more research when I am less sleepy. If I can say, for example, the DOW tends to move down 40 points whenever it rises 200 points in three days, then I can short it with confidence at intervals.

Again, I would long future contracts to hedge short positions.

Have a good night!

H
 
Regret

My regret about dumping PRU from my long list grew today.

It jumped 70 points plus thanks to the takeover talks.
 

Attachments

  • pru takeover news.jpg
    pru takeover news.jpg
    39.6 KB · Views: 136
Something fishy

hungvir said:
Placed a stop order to buy AZN at 2906 market price with Fins. The new platform is quite elegant and fast. I hope it will stay that way.

I only have 100 quids with Fins and that's only enough to place a 30p per point bet.

There must be something wrong with the way Fins skew their future prices.

I bought AZN June contract when the market price was above 2906. The share price was 2884 at the close today, 20 points below where I bought it. Yet the future price has dropped 44 points.
 

Attachments

  • astra at fins.jpg
    astra at fins.jpg
    19.1 KB · Views: 147
  • azn 2884.jpg
    azn 2884.jpg
    41.7 KB · Views: 167
I sold to open BARC at 581.8, it closed at 577.

I don't understand futures prices, either, Hung. The combination of skew and time value confuses me. I stay with rolling bets.

Split
 
Good that It went your way first. The chart looks bullish to me though.

I won't short a stock in this market again without hedging by longing futures. This does not mean that you can't make money going short. Just that the odds are not favourable.
 

Attachments

  • barc.jpg
    barc.jpg
    41.4 KB · Views: 155
LLOY's good run

I was stopped out of my LLOY long position and avoided the misery when it gapped down.

But I also missed the chance to ride the lift up. Lloyds has been talked about as a bid target and that may have been the reason.
 

Attachments

  • lloy.jpg
    lloy.jpg
    38.6 KB · Views: 167
Tpk

Travis Perkins has been trending up. To be honest I know nothing about this firm but would add it to my long list purely because the charts look good and their bid/offer spread is among the tightest.

If it continues to move down for two more days, I'll buy it when it starts to move up.
 

Attachments

  • tpk.jpg
    tpk.jpg
    42.9 KB · Views: 178
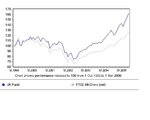
From: Is the Footsie heading for 10,000?

At a conference hosted by Funds Network, a fund supermarket, last month, Mark Lyttleton said that the index could exceed its December 1999 peak this year because, unlike at the turn of the millennium, company share prices are not overvalued and are backed up by strong growth in earnings.

Not that this bearish view of the market stopped him from taking charge of the long-only Merrill UK Fund in October 1999 of course. I'd love to see his predictions from the 1999 annual report. :)

Still, at least he's beaten the All Share which is more than can be said about most of them.
 

Attachments

  • untitled.JPG
    untitled.JPG
    20.1 KB · Views: 177
Hi Frugi,

I consider all comments as 'noise' and rely almost 100 per cent on charts. But it's good to know what fund managers are thinking. At the end of the day, if they don't buy, then the current trend can come to an end.

But I think the current frenzy must have drawn many novices to the market and many are (or will be) losing big money. Some talked about it on T2W while others just silently quit or swallowing the pain in solitude.
 
Top