Deadline June

OK, I'll add on your percentage and his percentage to the backtesting slippage and commission and see whether it ever makes a profit after that.

So why the need for so much precision? What makes this algorithm any different from any other indicator?
 
You're trading it on the CME future but measuring it on the Forex. And that's the first problem. The second problem is: what if you don't have the right forex data for some reason (even timeframe alone affects it)? I mean, if you just move the close by one hour you're going to get totally different pivots. I think your best bet is download data from the very data provider you'll be using to trade the system, which is IB. Then you should just pretend you'll trade the forex and forget about getting the signals from one chart and executing them on another. But when you'll execute it live, you will still need to get the pivots from the forex rather than from the future.

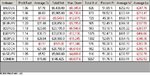
One more problem is getting the formula right. I am bad with formulas I know. And this may be a small problem for anyone else. But I don't even know what formula IB uses to calculate them. What I do know is that they seem to work on their chart (forex data). Let me show you the last 2 weeks for example (no hindsight, because I still haven't even looked at them):

red_circles_where_they_worked.jpg

I marked with red circles where they seem to have worked.

If you can get past these problems, I am pretty sure you can get them to give you an edge, regardless of how small it is. You see, i think that pivots are best when automated because patience is the most important requirement to trade them.

Maybe it's time for me to get involved in this before you get too far. I would like to be there when our share of profits materializes. Would you like to work on this together? On msn or skype?

Steps:

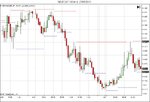
1) Download the last 2 weeks of data from IB and devise a formula to draw pivots on them, so that it matches completely the lines drawn by IB on the chart. The data we need is on a 5 minute timeframe. See example below:

20100805.jpg

2) Once we have a pivot formula that matches the chart, we can start the back-testing process and find a profitable formula (always all on forex data).

3) Once we have a profitable formula we download another 2 weeks from IB and see if it works on them. Then we start the process of automating the system, which will vary depending what platform we use.

4) Once we start making the money, we start the wiring process. You wire it to me, and I wire it to Gladiator. He then wires it to whoever told him that pivots work. In case of losses, we both sue Gladiator.

Ok, I am starting by downloading the data, since you're not replying.
 
Last edited:
OK, you are talking about those daily pivots, I'm talking about pivots that are just based on bars of whatever time frame you're using, and are independent of each other, where you have the current upper pivot (the resistance) and the lower pivot (the support), defined by a highest high (or lowest low) having 2,3,4 or 5.... bars on the left side and 2,3,4,5 or x bars to the right which are lower (or higher) than it.

Thanks for the offer of a deal. It sucks, but since you're Travis and obviously psycho, I agree before you send DeNiro and Pacino round to whack me.
 
Hey, I didn't come to the United States to break my ****ing back. Who put this thing together? Me, that's who! Who do I trust? Me!

We're not talking about your pivots but about those daily pivots, but my offer is still valid. You wanna go on with me, you say it. You don't, then you make your moves. I'm sure you'll do very well and good luck to you. Especially since your interests don't conflict with mine.

Step 1: I got the data from IB and customised it (see attachments). Now I need to set it up on tradestation and get the pivot lines to be the same as on IB's chart. I might have to do this another time, because I found a new bug on the existing systems to be taken care of. But I'll definitely get done with this before the end of the month.
 

Attachments

  • from_IB_to_TS.zip
    118.4 KB · Views: 72
Last edited:
By the way I trade retail forex, not futures.

Those pivot points of yours look interesting but right now I've got my working day all mapped out and it's not pretty. Plus there seem to be new opportunities to check out piling up faster than I can investigate them.
 
Killed by backtesting

Finally dragged my NinjaTrader strategy kicking and screaming out of backtesting and into forward testing after days of hacking, processing, tweaking, scrapping, re-doing and re-testing, and guess what, the damn thing sucks.

The forward test period is after the y axis.
 

Attachments

  • MyHTML1.gif
    MyHTML1.gif
    9.1 KB · Views: 143
This is on 30mins bars, it's not meant to have drawdowns of 6 months for crying out loud.

I guess I can up the time scale maybe and use it later when I've got more dosh.
 
Here's how good the optimisation results looked
 

Attachments

  • NinjaTrader Grid 11_08_2010 18_09.jpg
    NinjaTrader Grid 11_08_2010 18_09.jpg
    58.1 KB · Views: 134
I'm still hacked off about that walk-forward failure - although technically it wasn't a failure, the results of the walk-forward fell well within the bounds of what can be expected from the backtest.

I think the problem is that the profitability was probably not high enough in the first place to give a strong enough chance of a profitable walk-forward. Perhaps I could have enhanced the system more. I didn't want to overoptimise it and end up with a curve fit and a total walk-forward failure.

I don't think I used up too many degrees of freedom.

The basis of the system is support and resistance pivots defined by 3 higher highs, the resistance pivot point bar, then 2 lower highs.
 
Here's the chart with the support and resistance pivots.

I used 3 before and 2 after as the settings, although I played around trying to get optimal settings and discovered that 9 before and 1 after worked really well, and in fact probably 10, 11 or higher would be even better, but they didn't look so good on the chart and I figured I'd stick with "3 before, 2 after" to stay true to the system I had imagined when looking at the charts.
 

Attachments

  • $EURCHF (30 Min)  27_05_2010.jpg
    $EURCHF (30 Min) 27_05_2010.jpg
    91 KB · Views: 126
There's lots of minute little decisions to make about what should count, e.g. does the high of the pivot have to be higher than to the left and the right, or is it acceptable for the the high to be the same price as its neighbours? I decided it had to be higher, although that causes some pivot points to vanish off the chart.

But I want them to be quality pivot points that hopefully would be more likely to have predictive value.

Next I tested that alone with a stop and a target to see if it was profitable, which it wasn't by a long way, on 30min bars across my 10 forex pairs over 10 years, 2000 to 2009. Loads of trades of course. And I need loads, because the way I develop systems, each step reduces the number of trades and I need to have a decent amount left by the time I get it to be profitable.

I hate getting it to profitability and only then noticing that it trades just once a year on 5 min bars.

The drawback is of course that it takes 5 mins to do each backtest. I can use that time though to hunt down fresh ideas for the next step.

My main effort was to get some trailing stop mechanism in there, since I've already set up a system with a target and a stop.

The stops of any type - plain old $ trailing stops, parabolic stops - made the system badly unprofitable with bad % profitable trades and not much in the way of a great avg win : avg loss ratio.

So the trend filter had to be deployed - so the theory goes. I couldn't find anything to make it profitable, so I ditched trailing stops. I quickly tried time stops as well - hopeless.

As for filters, I tried different types of MAs, and ADX, and RSI, and then I started making stuff up. I made up one to measure the average number of consecutive trades in the same direction and surprisingly quite often it gets over 2 and sometimes up to 3 if on a short period.

None of this worked and of course taking 5 mins per backtest meant it was eating up my week but I really want a system I can run on all the currency pairs I'm testing on.

I discovered that Harami candlestick patterns strengthen the pivots - bearish haramis combining with resistance pivot points are good, and bullish haramis for support.

I put a volatility filter on this - I wanted the ATR to be expanding - so I measured the current volatility against the volatility at the last pivot point and if it had increased and there was a confirmation Harami, then go for it. Attach a target and a stop and you get those results above. Enough trades to make it likely to be predictive too.

I optimised the different currencies for the volatility / ATR period and that was it.

Shame it ain't no Holy Grail. When I've got x thousand to commit to a 10 year period, enough to handle a initial drawdown of 20 thou and possible "max time to recover" as ninjatrader says of 2 or 3 years, then I'll start trading it.

In the meantime it's back to the drawing board and perhaps some time sitting in my garden wondering whether it's possible to find anything better than that.

I'd love to see what results my Consecutive Runs indicator gives on 5 min or even 1 min charts. Probably not enough to get it over the commissions and slippage threshold.
 
Four horsemen of the Apocalypse just rode through my flat

If you like a good sob story, read on - if you can't stand too much negativity, click your way outa here because the last 12 hours were bad, worse than they ever have been, and I need a little break to vent off some of the built-up pressure.

Fortunately this is happening when my girlfriend and little girl were away so they don't have to experience the near-implosion going on around here. It started off small yesterday when I noticed some blips in the backtest results for a system scalping 5mins bars in the currencies. I thought it'd just be another little bit of code in the wrong place and easily sorted.

When I checked the situation, I found that NinjaTrader7 had just totally lost the plot on one bar in one of the backtest batch runs. It executed 3 trades at prices that were 100s of ticks away from the OHLC.

I have no idea why it would do that unless it's a bug. According to my code, it should never be able to enter and exit on the same bar, let alone perform 3 trades. So I figured I'd start checking the data first.

I switched to the other machine that's running a similar system in simulation on live data, and it was making a heavy loss. Instead of 55% winners, it was giving me 35%.

I checked the data on that machine, and I compared it to the data on the first machine, and then I deleted the data from both machines and reloaded it from different sources and suddenly I don't care about dumb beta software messing up my backtests, because all the data is different.

I've got 4 sources of OHLC 5 min bars and they are all different at the point in time where NinjaTrader went ape**** - I don't know whether the data caused it but I am totally blown out of the water.

I've got:

(1) tickdata from Disktrading which NinjaTrader used to create 1 minute bars.
(2) 1 min bars from IB historical data servers
(3) tickdata that NinjaTrader has collected from the IB live feed since Feb this year
(4) 1 min bars from IQFeed which I signed up for last month after hassle with IB's historical data farms

And they are all different for that bar, varying by up to 5 ticks.

Then out of the blue, IQFeed shuts off and won't reconnect telling me I've been disconnected.

The only one I would really trust is (3) because that's what I trade against.

So now I've got to work out what on earth to do. I pulled the plug on my 30 mins EURUSD system, it wasn't doing too well and I need to check what's what.

I ran a 5 min scalping system on the Disktrading data and thought I was getting somewhere until last night - it was scoring $15 per trade before costs.

I tried it against the IB historical data on the other machine this morning and it registers -$8 per trade. This is just insane.

I thought the difficult part of trading was taking the losses but this beats losses anyday. 50% drawdown? Bring it on! I'd rather have 50% drawdown on a system I trust than have to deal with this sort of crap.

The worst thing is that it seems that I can't get definitive data from IB - their historical data is different from what I collected live from them. If I can't run backtests on data that was actually traded, how am I meant to have any faith in my system? I guess the only option I have is the simulated trading. Up until now I always thought the out-of-sample test on historical data would be definitive and the simulated live trading would be to prove that there's no difference in the trading mechanism between backtesting and live trading. I need to stop being so damn naive.

And what do I do with the disktrading data? I could happily just delete it right now.
 
You've got to keep everything simple and basic. Look at me:

1) I am using tradestation 2000i. It's over 10 years old, but it's reliable, I know it by now, and so I will use it forever.

2) The data. If the data files are very different, it could be due to wrong timezones, or to the fact that one data set has the 4 PM bar starting at 4 PM, and the other one has it ending at 4 PM. If the data is not that different, then you've got to work on simpler systems that won't react so adversely to slightly different data: this is actually a good way to know if your system is good. If the data is slightly different and the results totally change, then it was probably over-optimized.

Sorry if this advice is stuff you already know. I was also partly explaining it to myself.
 
But I stuck with TradeStation4 right up to this January. It was reliable, that's for sure. It just couldn't handle tickdata from Disktrading. They had omz files but it would crash every time I tried to import it. Probably a Y2K thing or another date / time problem.

You might be right about the 1 min bars from IB. NinjaTrader creates and uses 1 min bars using the last timestamp of the bar as the timestamp for the bar. If IB use the start of the bar, then it would be different but the bars from before, simultaneously and after which I just downloaded from IB are different to the bar that I had in NinjaTrader which was created by NinjaTrader as it saved the tick data.

You're definitely right about the systems, and keeping them simple, and although mine are simple compared to before (only an indicator and two filters max), I could simplify it more and sticking to 1 hour time frames would be a good idea under the circumstances if I'm going to use disktrading data.

I got such a buzz yesterday before the crap hit the fan. I had $15 per trade coming in at 2 trades a day per mkt. I guess it made me react worse to this latest bull****.
 
I am glad you agree with me. You know, in case you want to try it, tradestation 2000i doesn't have any of these problems, and it can be downloaded on emule. But then I'd be encouraging you to try yet another platform. If you trust ninjatrader, stick with it and make the best of it. I don't trust it, because its name reminds me of a cartoon. I can't take it seriously. How can it be a serious software? It would be like putting your money in a bank named after a brand of cereals. Kind of like "thinkorswim". What the hell of a name is that? There's no way I'll try opening an account with a broker like that.
 
Yes, NinjaTrader takes top honours for a pathetic name. Their tagline is something like "trading excellence through stealth and discipline". When I downloaded it I was pretty worried, but I got used to it. After all this forum is called Trade2Win - the whole business is based on retail clients acting like children chasing a dream, so I figured I might as well admit that's what I'm doing.
 
Yeah. And it sounds a lot like "Nintendo trader" as well. I'd rather go for a boring name like "tradestation" and "interactive brokers", rather than "ninjatrader" and "thinkorswim". In general, I'd recommend to choose the most widespread platform among those users writing on the Automated trading section of Elitetrader.com. Those guys know what they are doing. Also, I'd recommend using the most used broker by them. In both cases, you can't try them all, actually you can't even try 2 of them. So what you do, for brokers and back-testing platforms, is you first find the best forum - you can try them all in this case - with the best traders knowing what they are doing. Then you read and read, and then you pretty soon come up with an idea for the best broker and best back-testing platform. Being from Italy, it was easy because it was like a filter. Only the good ones are known here - so back in 2002 I had only ever heard of Interactive Brokers and Tradestation. I didn't even have to worry about choosing. So your best bet is see what product they use in Burundi or in Easter Island. It's like for movies. A crappy movie with Tom Cruise will be known to people today, and in ten years. But in 50 years, no one will know who Tom Cruise was. Distance and time act as a filter for letting in only the good things, and the bad things don't come through.
 
That's more or less what I did, plus I wanted my money with the biggest and the one with the most apparent security. I visited Elitetrader but I didn't stay long. There was one thread I was on and some crazy guy just wouldn't stop swearing, f*** and c*** all the time. I figured it was always like that but I do read stuff there when someone links directly to it.

I don't think NinjaTrader is small, in fact I think they rival TS. They have phenomenal support. Usually intelligent answers within an hour during business hours on their forum, about 10 guys there posting help all the time.

But still, they should ditch the name! Call it something sensible as you say. Like SexyTrader.
 
I would suggest something like "trading program" or "trading application". I am glad you at least use Interactive Brokers like me, so maybe one day we might do something together, like transferring money from one account to the other and such...
 
Top