jrplimited
Active member
- Messages
- 249
- Likes
- 1
Re: longer term market view....
Hi Neil,
Dont know whether or not this obserbvation/comment will be of any use to you, but....
We have both "seen" a fair degree of non-correlation lately and for me this has been acute in G/E/U relationships, suggesting that fundementals have overtaken technicals - fiscal worries in Euro zone, disbelief in UK to tackle debt immediately, extent of coming year's budget defecit in US etc., so perhaps you are trying to find a correlation with other financial instruments that might not exist right now.
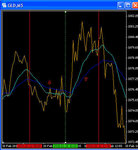
Also when you use the longish MAs these are, as you know, looking at a SUM price X bars ago and contain a lot of lagged data, might be OK for any trends but a nightmare when the chop monster comes a-calling! For me this is the biggest problem in that if price pops its head above a MA traders want to buy it (maybe with some other blanket hugging indys confirmation) when in fact the "real" price action rise could well have occurred some bars ago and therefore what is seen is really, in retrospect, a retrace or false breakout.
I've read many articles in TASC over the years where long/medium term MAs were debated and I cant recall any conclusion ever being made over their use, apart from the fact that they are great in trending markets but killers in sideways ones. However with your application on MAs on the corrie indy I think you are probably on the right track by looking for local S and R junctures and not relying on the indy itself to merely cross MA.
As you know I use your corrie indy with the raw settings so it mimicks actual real time price action, downside of this of course is that you will frequently be jumping in and out of the market when chop monster visits, but and like a medium/long term MA you can "afford" to stay in the market longer whenever a trend manifests itself - ie small term gyrations in price will occurr some way above an entry point abd can be ignored.
Why dont you try a sort of re-construction of your corrie concept by capturing a good length segment of data and then modelling this with various settings to see exactly how the whole thing behaves? With this you could adjust for important criteria such as pre and post London session (ie differing aspects of volatility and the like), different characteristics of the singled currencies and their direct relationships between one another (ie G, E and U etc) and any other ideas that come your way.
Starting off with the "raw" output and building from this might well reveal some other aspects that perhaps you and all of us are overlooking right now. I certainly feel there is a lot more to this correlation thing than what I'm currently seeing with your indy, but typically cant for the life of me put my finger on it - I'm actually right in the process of doing whats written here and going back to square one again!
Anyway food for thought for you, take care.
Simon.
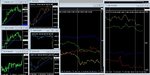
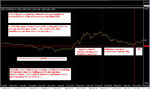
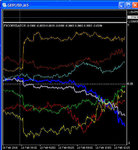
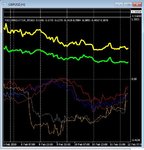
heres a 4h 1000/1 market index corrie....
tag as usual.....the rest are commodities and equities....gold is gold and grey is the dow
See how gold and then the Dow gave early indications in jan (by falling) that tag was going to fly up ?
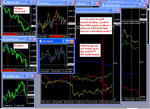
an look at 4th feb and diversity of the dow/gold verses Ftse/Dax and crude oil....what was that about ?.......a superb convergence trade if we understood these dynamics 👍
and now we see them below the others and starting to dip downwards again ?......but ftse/dax/crude still going north ???? 😢
I am still a novice on all of this......but I can see that perhaps these indicators/signals could allow trading the markets independently as well as alongside the forex as more exotic cocktails/basket plays....but 1 step at a time :whistling
anyone care to pitch in with observaions / comments ?
I am a novice at all of this and use this and more other focused indicators in my more private work....although thats about 10 mins a week at the moment !
but with obsevation and experience it will gradualy take shape for me and help my trading career when it (eventually 🙄) starts again....
Neil
NVP
Hi Neil,
Dont know whether or not this obserbvation/comment will be of any use to you, but....
We have both "seen" a fair degree of non-correlation lately and for me this has been acute in G/E/U relationships, suggesting that fundementals have overtaken technicals - fiscal worries in Euro zone, disbelief in UK to tackle debt immediately, extent of coming year's budget defecit in US etc., so perhaps you are trying to find a correlation with other financial instruments that might not exist right now.
Also when you use the longish MAs these are, as you know, looking at a SUM price X bars ago and contain a lot of lagged data, might be OK for any trends but a nightmare when the chop monster comes a-calling! For me this is the biggest problem in that if price pops its head above a MA traders want to buy it (maybe with some other blanket hugging indys confirmation) when in fact the "real" price action rise could well have occurred some bars ago and therefore what is seen is really, in retrospect, a retrace or false breakout.
I've read many articles in TASC over the years where long/medium term MAs were debated and I cant recall any conclusion ever being made over their use, apart from the fact that they are great in trending markets but killers in sideways ones. However with your application on MAs on the corrie indy I think you are probably on the right track by looking for local S and R junctures and not relying on the indy itself to merely cross MA.
As you know I use your corrie indy with the raw settings so it mimicks actual real time price action, downside of this of course is that you will frequently be jumping in and out of the market when chop monster visits, but and like a medium/long term MA you can "afford" to stay in the market longer whenever a trend manifests itself - ie small term gyrations in price will occurr some way above an entry point abd can be ignored.
Why dont you try a sort of re-construction of your corrie concept by capturing a good length segment of data and then modelling this with various settings to see exactly how the whole thing behaves? With this you could adjust for important criteria such as pre and post London session (ie differing aspects of volatility and the like), different characteristics of the singled currencies and their direct relationships between one another (ie G, E and U etc) and any other ideas that come your way.
Starting off with the "raw" output and building from this might well reveal some other aspects that perhaps you and all of us are overlooking right now. I certainly feel there is a lot more to this correlation thing than what I'm currently seeing with your indy, but typically cant for the life of me put my finger on it - I'm actually right in the process of doing whats written here and going back to square one again!
Anyway food for thought for you, take care.
Simon.