Best Thread Correlation Trading - Basic Ideas and Strategies

NON correlation - Example

look

corrieindex says top floor for markets mostly - GBP going south

GBP is not correlating to the market.....

well actually technically nether is the tag as they are moving up with the market which again is non-correlation.....only dude behaving is Euro at the moment !

Euro seems in charge now ?

N
 

Attachments

  • noncorrelation.jpg
    noncorrelation.jpg
    103.9 KB · Views: 182
Hi N and all else,

Quel damage, there was more chop around in this morning's market than there is in a butcher's shop! Anyway, enough of the whinging and onto some wtf trades....

E/U For first trade I took a short on 08:25 bar at 46953 and immediately found myself with a 14 pip MAE, then price dropped with a bang on the 08:35 bar so relief took over and just as I was thinking about moving initial SL price moved violently upwards again, and again, and took out my SL for 19 pips loss - that really hurt. Second trade was a buy stop at 47268 which was filled during 10:10 bar and that naughty price retreated down again after my fill, spiked upwards on next bar only to settle down again, then rose upwards quite strongly, drifted down for four bars, popped up again on face saving 10:45 bar then meandered a bit more which represented a scream to me to start trailing price more tightly in case of a big spike downwards. The 11:15 bar broke through this tight TS for a 9 pip profit.

G/U Had to wait until after that big 08:10 up bar as it distorted everything for me and eventually got a good (?) long signal at 08:55 so went long next bar open at 62962 and fell straight away into a fairly deep retrace that took my SL out during 09:10 bar for a 22 pip loss - ermm, that aint supposed to happen! Caution needed here me thinks... Watched shallow rise upwards again and set buy stop at 62952 which was a tad below previous unforgiving long setup but market certainly had a long bias thus far. Order filled during 10:10 bar and off I went, suffering a MAE of 12 pips at the 10:40 bar and an agonising climb up to the peak 11:35 bar and deciding to exit rapido at the close of 11:40 bar for 17 pips profit.

E/G Again, didnt care much for that 08:10 big down bar so decided to sit quietly on side lines and look for a short setup after the third "wave" of down moves post 10:10 bar as market was certainly short biased. Sell stop set at 90312 and got filled by one pip (yikes!) during 11:00 bar, price floated agonisingly downwards then got a boost followed quickly by a rather large up bar at 11:40, then another two small up bars in sequence and during the final one of these (11:50) I decided to close out for a 11 pip loss.

So all in all a very strange morning for me as I was "sure" I had the market bias right, but nothing really went my way. The good news was it was nearly midday so I could mull over what pair to look at ready for the afternoon; the bad news was I would have been quicker flushing my working trading capital down the toilet instead of handing it over to the markets!

Not a gay day by any means.... Ah well, onwards and upwards.

Trade well (I naffing well didnt!) and regards,
Simon.
 
good..............the markets continue to stay on top floor and looks like the Europair are finally turning to follow !

this will be a completely unseeable trade in normal pairs strategy stuff

N
 

Attachments

  • better.jpg
    better.jpg
    108.4 KB · Views: 168
honestly i'm not cheating.........someone cam ein with a question and stopped me
between this post below and the next one where i gloat !

(anyway yuo sdan see where the bars end !

Nl
 

Attachments

  • better and better .jpg
    better and better .jpg
    101.3 KB · Views: 317
hoorah

an unseeable (?).......7-8 pips (red horizontals) on the G/U

sorry this is Crap but i'm trying to show a consistent set of circumstances here to generate a trade............

  • Markets going up on 1m and 5m corrie index
  • USD going down
  • trade best looking - euro or GBP

ok..........enuff USA waking up now............ !!!
N
 

Attachments

  • fast 8 pips.jpg
    fast 8 pips.jpg
    103.4 KB · Views: 606
Ummm..........so much for 8 pips.....the calvary has arrived !!!

markets showing pm intentions now ?

N
 

Attachments

  • WOW.JPG
    WOW.JPG
    104.9 KB · Views: 473
DOH.........really busy so got to sign off

JRP......whats cooking ?

N
 
Hi N,

See previous page posting at bottom of page. In a nutshell, I was cooked good and proper today - a la Christmas turkey!!

Simon.
 
all change


markets shaping up for big fall ?

N
 

Attachments

  • all change.jpg
    all change.jpg
    105.3 KB · Views: 226
Euro kicking butt....

markets and USD falling (????)
 

Attachments

  • euro stud.jpg
    euro stud.jpg
    105.5 KB · Views: 236
Hi N,

See previous page posting at bottom of page. In a nutshell, I was cooked good and proper today - a la Christmas turkey!!

Simon.

sorry to hear mate..........anything that you regret doing in hindsight ?

(tell me later)
N
 
Moving averages

words of wisdom from Mr Yeoman

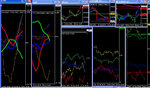
the corrie is basically a moving average based Strengthmeter for the G8.... so i'm going to study this a lot and see if theres anything to use....


WAYS TO TRADE MOVING AVERAGES

Reading a chart without moving averages is like baking a cake without butter or eggs. Those simple lines above or below current price tell many tales, and their uses in market interpretation are unparalleled. Simply stated, they're the most valuable indicators in technical analysis.

You can trade without moving averages, but you do so at your own risk. After all, these lines represent median levels where your competition will make important buying or selling decisions. So it makes sense to predict what they're going to do before the fact, rather than afterward.
Here are 15 ways you can manage opportunity through moving averages:

1. The 20-day moving average commonly marks the short-term trend, the 50-day moving average the intermediate trend, and the 200-day moving average the long-term trend of the market.

2. These three settings represent natural boundaries for price pullbacks. Two forces empower those averages: First, they define levels where profit- and loss-taking should ebb following strong price movement. Second, their common recognition draws a crowd that perpetrates a self-fulfilling event whenever price approaches.

3. Moving averages generate false signals during range-bound markets because they're trend-following indicators that measure upward or downward momentum. They lose their power in any environment that shows a slow rate of price change.

4. The characteristic of moving averages changes as they flatten and roll over. The turn of an average toward horizontal signifies a loss of momentum for that time frame. This increases the odds that price will cross the average with relative ease. When a set of averages flatline and draw close to one another, price often swivels back and forth across the axis in a noisy pattern.

5. Moving averages emit continuous signals because they're plotted right on top of price. Their relative correlation with price development changes with each bar. They also exhibit active convergence-divergence relationships with all other forms of support and resistance.

6. Use exponential moving averages, or EMAs, for longer time frames but shift down to simple moving averages, or SMAs, for shorter ones. EMAs apply more weight to recent price change, while SMAs view each data point equally.

7. Short-term SMAs let traders spy on other market participants. The public uses simple moving average settings because they don't understand EMAs. Good intraday signals rely more on how the competition thinks than the technical's of the moment.

8. Place five-, eight- and 13-bar SMAs on intraday charts to measure short-term trend strength. In strong moves, the averages will line up and point in the same direction. But they flip over one at a time at highs and lows, until price finally surges through in the other direction.

9. Price location in relation to the 200-day moving average determines long-term investor psychology. Bulls live above the 200-day moving average, while bears live below it. Sellers eat up rallies below this line in the sand, while buyers come to the rescue above it.

10. When the 50-day moving average pierces the 200-day moving average in either direction, it predicts a substantial shift in buying and selling behavior. The 50-day moving average rising above the 200-day moving average is called a Golden Cross, while the bearish piercing is called a Death Cross.

11. It's harder for price to break above a declining moving average than a rising moving average. Conversely, it's harder for price to drop through a rising moving average than a declining moving average.

12. Moving averages set to different time frames reveal trend velocity through their relationships with each other. Measure this with a classic Moving Average-Convergence-Divergence (MACD) indicator, or apply multiple averages to your charts and watch how they spread or contract over different time.

13. Place a 60-day volume moving average across green and red volume histograms in the lower chart pane to identify when specific sessions draw unexpected interest. The slope of the average also identifies hidden buying and selling pressure.

14. Don't use long-term moving averages to make short-term predictions because they force important data to lag current events. A trend may already be mature and nearing its end by the time a specific moving average issues a buy or sell signal.

15. Support and resistance mechanics develop between moving averages as they flip and roll. Look for one average to bounce on the other average, rather than break through it immediately. After a crossover finally takes place, that level becomes support or resistance for future price movement.

N
 
finally got correlation all round on 1m and 5m.....so this should last 5 seconds !!

N
 

Attachments

  • pulling teeth.jpg
    pulling teeth.jpg
    101.3 KB · Views: 125
going ok on g/U.......GBP heading for Resistance on 30m chart !!!
 

Attachments

  • going nicely.jpg
    going nicely.jpg
    114 KB · Views: 138
I think the market is turning....loss of momentum now so europair going north ?

N
 

Attachments

  • all change.jpg
    all change.jpg
    115.5 KB · Views: 113
Nope.....the market is a twisty turny thing !

N
 

Attachments

  • ouch.jpg
    ouch.jpg
    108.9 KB · Views: 119
now north for GBP ?

N
 

Attachments

  • GBP north.jpg
    GBP north.jpg
    99 KB · Views: 135
Top