Best Thread Correlation Trading - Basic Ideas and Strategies

Not sure about this bit though........

This attachment from Webpage above shows the correaltion Grids......but this is probably why most people's eyes glaze over when it comes to this powerful weapon !

I've highlighted in blue one correlation line....

the AUS/USD vs the EUR/CHF = +0.9 on an annualised basis....

Dont get me wrong this is pukka information and well presented - however - I prefer the FXCorrelator......it tells me each currency as a standalone entity and I do my correlating vs other currencies on the Chart by eyeballing them in the Moving average lengths and timeframes of my choice..

In my world the AUS generally moves opposite to the USD and the EUR/CHF....well you know about their love affair already !

let me post you what I mean re FXCorrelator and +/- correlations
Neil
 

Attachments

  • correlation grid.jpg
    correlation grid.jpg
    45.1 KB · Views: 1,153
Usual correlations vs the FXCORRELATOR

ok...running out of time now as i'm off for long weekend with the wife, so this
could be last until Tuesday (thank god they cry)

following on from previous comments please look at the Attachment and tell me the correlations for each Letter/area........

Scores
that is 100% = exactly correlating (say 50% = not really correlating)
Plus = in the same direction
minus = in the opposite correlation

therefore I am hopeful that based on my waffle in the early posts we will get some decent high % positve scores for Euro Vs CHF and likewise the USD vs the YEN

to make it a real Test I will publish answers in next post

this is 200ma and 13 Delta (smoother movements to help a little) on tjhe 1h TF

go on ....do it !
Neil
 

Attachments

  • FXCORRELATOR_% PLUSMINUS.jpg
    FXCORRELATOR_% PLUSMINUS.jpg
    71 KB · Views: 2,348
the Answers.....

ok kiddy's heres the answers.....

Area A
USD & YEN are very high % and positively correlated as parrallel and moving in the same direction (YES YES YES).....fix you cry !
bonus points for spotting the NZ$ (light blue) moving upward roughly upwards in parrallel as well with these (but positioned higher up the chart)

Teacher Teacher - does the distance physically between them have an impact on the results ? Glad you asked that lad...answer is it depends on the MA's being used (??!!)
I will come to this in a future post...until then lets say that generally as long as they are moving parrallel in longer MA's (the 200 we are using) then yes they are roughy moving together

Area B
high % and positively correlated - USD (GREEN),AUS$(Gold),NZ$ (L.Blue)
(Euro and CHF are also correlated together but not to above)
Note that GBP (Red) is highly negatively correlated to teams above
CAD (Brown) is doing its own thing !

Area C
high % & +corry (all below based on the teams)-
Team 1 = CAD & AUS$
Team 2 = Yen/ USD and swissie (??)
Team 3 = EURO(Blue) and NZ$

so 3 teams but in terms of Directions Team 2 is negatively correlated
to teams 1 and 3.....(see! - the tag team Yen/USD always opposite to most others)

Area D (can I go home yet ?)

Awe cmon ........3 lines below the zero are similar (not including GBP)
the Currencies above the Zero (above horrizontal X axis) are all running similar
and the GBP is doing the opposite to them all !

Area E
most all flowing together.....and the GBP is a nice high % opposite to all of them !

ps - you find this when a currency gets a major news/events "hit" that affects its relative pricing to the others (up or down).......because the other currencies are performing/cycling normally with no major news impacts they seem to tighten up- leaving the news/event impacted currency spinning off in its own orbit....

this is actually a real pain as it will take quite a while for normailty to return to the Chart so you can start observing normal cycling again (hence the famous maxim - dont trade during news events or following them until the market settles again - or leastways any trading regarding the news effect Currency )

Test over !
Neil
 
Last edited:
ok thats it....i'm late for meeting my wife,so the long weekend off to great start.......may need some good bachelor website addresses then on return next tuesday !

all have good ones
Neil
 
ok thats it....i'm late for meeting my wife,so the long weekend off to great start.......may need some good bachelor website addresses then on return next tuesday !

all have good ones
Neil

I have come across a course by a guy called Syd Wynemann (I think his site is called forextrainingworks - or something like that). He is a very difficult chap to work with and his correlation is based around the gbp/usd, eur/usd and usd/xxx working in tandem at certain times of the day.

He does have a following, but I couldn't put up with his talks when he kept on dumbing down everyone and taking 2 hours to put across the same message !! (sorry to be so nasty!)

Anyway, the summary was that there were some people that made it work - but not really for large numbers. I have some ahem "snippets" of the course available with the key pages for anyone if they want to see them.

I definately didn't make money with it though, have made consistent money with signals/mentoring I have mentioned in earlier posts.

Good luck guys
 
Correlation Charts

I have come across a course by a guy called Syd Wynemann (I think his site is called forextrainingworks - or something like that). He is a very difficult chap to work with and his correlation is based around the gbp/usd, eur/usd and usd/xxx working in tandem at certain times of the day.

He does have a following, but I couldn't put up with his talks when he kept on dumbing down everyone and taking 2 hours to put across the same message !! (sorry to be so nasty!)

Anyway, the summary was that there were some people that made it work - but not really for large numbers. I have some ahem "snippets" of the course available with the key pages for anyone if they want to see them.

I definately didn't make money with it though, have made consistent money with signals/mentoring I have mentioned in earlier posts.

Good luck guys
Thanks Jansher21 - will check that site.

Meanwhile here is an interactive tool which could be indispensible to the true believer:

Forex Correlation - Mataf.net

It allows users to compare the correlation of any pairs they wish, instantly!
 
Thanks Jansher21 - will check that site.

Meanwhile here is an interactive tool which could be indispensible to the true believer:

Forex Correlation - Mataf.net

It allows users to compare the correlation of any pairs they wish, instantly!

I really would like to stress though, that I don't know anyone who has made even semi-decent money in correlation trading. They are very much short term plays and the short term nuances can disappear and be wrong quite quickly - hence very difficult and very dangerous to leverage.

The head of the team of traders I am working with, is up around $7m this year - that is the serious stuff.

People can get in touch with me if they want to know where the action is.

Good luck guys.
 
Other links

I really would like to stress though, that I don't know anyone who has made even semi-decent money in correlation trading. They are very much short term plays and the short term nuances can disappear and be wrong quite quickly - hence very difficult and very dangerous to leverage.

The head of the team of traders I am working with, is up around $7m this year - that is the serious stuff.

People can get in touch with me if they want to know where the action is.

Good luck guys.
All good comments Jansher21 ... thanks.

I had a look at the Sid Wynemann site - one of the few that stand out as genuine.

Could you give us a bit more insight into how correlation can be traded in the short term, because atm I am just gathering info and trying to use it to develp an edge. It may be that Correlation is just an interesting phenomenon that doesn't offer any more edge than a straight trade, but it's worth digging into.

Meanwhile, I discovered other links of interest -

Using Currency Correlations To Your Advantage

Developing a System #2 (Entry system for hedging correlated pairs) | Forex strategies revealed

... and one for the mathematicians and abstract enthusiasts ...

kreslik.com - Traders Community :: View topic - FPI - Fractional Product Inefficiency: The Impeccable Hedge

NVP was looking for all this stuff - and we are slowly coming up with some good sites that treat the subject well.

Cheers mate

Ivan
 
This should stir the farmyard into action!

During my incessant Googlings, I came across this one from the Mataf Forum:


1. Go do dailyfx.com and click on "charts" and "live charts" and open up a EUR/USD .
2. Click on "instruments" and overlay a GBP/USD chart.
3. Choose any timeframe (I use 30 minutes).
4. Notice how the currencies flip flop, up and down on each other. At one time GBP/USD will be on top, then a couple hours later or a day later EUR/USD will be on top.
5. Buy the currency that is on the bottom and simultaneously sell the currency that is on the top.
6. When they converge and cross exit for the win.

So we are entering the position when there is a gap between these currency pairs, and we are exiting when the currency pairs cross (the one that was on the bottom is now on top, the one that was on the top is now on the bottom).

Obviously the bigger the gap between the two currencies upon entry the better.

I trade with 1000 units per $100.00 account balance or 10,000 units (mini lot) per $1,000.00 account balance.

This system has produced a return of approximately 15% on my account balance in the previous week.

This can also be done with GBP/JPY and EUR/JPY.


I used "Powercharts" from the 6 displayed on Dailyfx.com site, and to clarify:

1) Click on "Powercharts" and wait for the Java to load up
2) Once open, from the Toolbar, select "Instruments"
3) From the drop-down menu select "EURUSD"
4) Right click on that chart, and from the drop-down menu, choose "Overlay" then "GBPUSD"
5) GBPUSD will display as a LINE chart.
6) Right click the chart again to choose "Chart Type" and change to "Line" - changes EURUSD to Line Chart
7) Right click chart again to choose "Time Scale"

Having both displayed as Line Charts is best - you don't need to see bars or candles - just relativity.

Now we really do have something to discuss!

Note: From the original post: Obviously the bigger the gap between the two currencies upon entry the better
I will be trying this today.

Questions:

1) Does it work
2) Has the author chosen the optimal pairs to trade this thing?
3) What is the risk?
4) How can we mitigate that risk?
5) What TF is optimal for such a strategy
6) Is there really a positive expectation in such a system (more than random chance?)
7) Ask your own question!

Link: Correlation And Hedge Strategy - Forex Forum

Posted by "Dreamliner" on the Mataf forum - "Dreamliner" also posts on other forums I believe. The lack of follow-up suggests this method was also less successful than the author had hoped!

Can we change that outcome?
 
Last edited:
All good comments Jansher21 ... thanks.

I had a look at the Sid Wynemann site - one of the few that stand out as genuine.

Could you give us a bit more insight into how correlation can be traded in the short term, because atm I am just gathering info and trying to use it to develp an edge. It may be that Correlation is just an interesting phenomenon that doesn't offer any more edge than a straight trade, but it's worth digging into.

Meanwhile, I discovered other links of interest -

Using Currency Correlations To Your Advantage

Developing a System #2 (Entry system for hedging correlated pairs) | Forex strategies revealed

... and one for the mathematicians and abstract enthusiasts ...

kreslik.com - Traders Community :: View topic - FPI - Fractional Product Inefficiency: The Impeccable Hedge

NVP was looking for all this stuff - and we are slowly coming up with some good sites that treat the subject well.

Cheers mate

Ivan

Syd is genuine, but also very difficult and annoying to work with. I can give people the summary of his work if they are interested.
LOL - if you ask Syd anything like that question, he kicks you off the course !!

Correlation is a good side project guys, not to put any serious money on.

Please take care not to get burned in correlation too much.

My only goal, is to stop traders losing money - and help as many make money as possible.

Good luck guys.
 
I'm back..........

Hey all !

i'm back and surprisingly still married despite all efforts to upset my better half for 3 uninterupted days together....

Ingot54/Jansher21 thanks for the input ....i'll have a look at everything offered up

I agree with comments being made......I personally think that you need to be eyeballing price action to pull the trigger on a starightfoward trade (hedging / multiple trades are different) but I would like to use correlation as my Edge to get me on the right horse at the right time...........

also newbies can learn a lot from observing Currencies this way.....great for seeing how its a big world out there and not just the USDGBP pair in isolation for example

i'll try to get plenty more on the thread in next few days.....work and other committments allowing

meanwhile Jansher21....I will try to show you some examples of how one could possibly trade my FXcorrelator real time on the lower TF's today if I get the time to load it

Meanwhile thats just reminded me of a thread that is going quite well on this site and they mentioned something about correlations in the early posts..hmmm

Neil
 
hey ingot54 - man you're on fire !

Ivan

just seen your post about the Farmyard a couple back ........now we're cooking !

DailyFX is an excellent site allowing one to access forex charts in quite a simple formats and also load/save multiple charts if you want to

the FXcorrelator set on 200Ma with a Delta of 2or3 will show the effects you describe wonderfully well - and how currencies crossover (breakout trades) and also allow trading on o/b,o/s signals when you can see them with a large gap between the lines (as mentioned earlier in my EURCHF posts and indicator

now heres the fun part........I believe that one can enhance your edge by indentifying such divergences on favoured Pairs against what the other currencies are doing at that point..............remember currency trading is a ZERO SUM GAME unlike any other form of trading.............for example if Yen and USD are rising then some of the other 6 currencies must be falling (if not all falling).....it all has to add back to zero in % movement terms !

what you are describing in your thread is running 1 currency pair relationship against a third currency and demonstating how the Pairs relationship can change when they both move against currency 3...you are deriving profit from the fact that GBP has a much highter volatility than the Euro....soooo watch your stops if you can/are using them

let me show this attached on the FXcorrelator......can this be traded for long term consistent profit ?.....are their better pairs ?.....ummm not sure, thats what we are here for chewing the cud....

Neil
 

Attachments

  • FXCorrelatorEURGBPretraces30m.jpg
    FXCorrelatorEURGBPretraces30m.jpg
    78.1 KB · Views: 2,890
one more point..........

yes folks it really is sad how things pop into my brain after i post !

Ivan I forgot to add........notice how on the Chart in previous post one would have made a lot more dinaros trading the GBPUSD pair retrace at points A and B (instead of GBPEUR) when the divergence of Europound was highest..............Zero sum Trading (ZST)

hmmmmmmmmmmm !!!

Neil
 
The best made plans.......

Hi all

Other schedules / priorities are gonna be a real pain this week.....

This is what i want to get out there as soon as I can - plus the items people have brought to the tabl for research / comment plus whatever comes our way !

USD on FX Correlator vs the US Dollar index....uses/how close ?
Full explanation of the FXcorrelator and how to use it (about time NVP)
Gold vs forex Correlations + a Gold indicator and trading ideas
Crudeoil vs Forex + an indicator
Global Equities vs Forex + (guess what) an indicator
Commentries of current Market conditions + expectations (?)
FXCorrrelator - Dollar/Yen Tag team average line vs the Vix....uses/how Close ?

If I write it down I will do it (ha ha ha ha ha )
Neil
 
Yes! We are on the same page!

Ivan

just seen your post about the Farmyard a couple back ........now we're cooking !

DailyFX is an excellent site allowing one to access forex charts in quite a simple formats and also load/save multiple charts if you want to

the FXcorrelator set on 200Ma with a Delta of 2or3 will show the effects you describe wonderfully well - and how currencies crossover (breakout trades) and also allow trading on o/b,o/s signals when you can see them with a large gap between the lines (as mentioned earlier in my EURCHF posts and indicator

now heres the fun part........I believe that one can enhance your edge by indentifying such divergences on favoured Pairs against what the other currencies are doing at that point..............remember currency trading is a ZERO SUM GAME unlike any other form of trading.............for example if Yen and USD are rising then some of the other 6 currencies must be falling (if not all falling).....it all has to add back to zero in % movement terms !

what you are describing in your thread is running 1 currency pair relationship against a third currency and demonstating how the Pairs relationship can change when they both move against currency 3...you are deriving profit from the fact that GBP has a much highter volatility than the Euro....soooo watch your stops if you can/are using them

let me show this attached on the FXcorrelator......can this be traded for long term consistent profit ?.....are their better pairs ?.....ummm not sure, thats what we are here for chewing the cud....

Neil
Man - this is going to be exciting Neil.

This is exactly what I was looking for ... but in other places!

Now - the beauty of this approach is that when looking at the relationship between several pairs, you can see that some are rising, some are falling, some doing very little, before taking off ... R-E-L-A-T-I-V-E to the others.

BECAUSE it is a zero sum game, that is precisely WHY we are able to place them all on the same axis, and visualise the price movement relative to each other.

Now ... here come the punch :

IF we can see the movement relative to other pairs (because of the common axis) then we can very easily commence a series of rolling trades, to take advantage of the changing relationships. In effect, we are just one step behind the Interbank and Foreign Exchange houses here - just on a micro-scale. We do not need to know the name of the pair until just before we wish to place our trades. All we need to look for is the widening/narrowing of Price relative to other pairs.

The "Mean" is the common axis around which all pairs revolve - and what we are doing is trapping the pairs as they revert to the mean. Of course, while they perform this little move, others are moving away to take their place.

Beautiful and brilliant - how long has this been going on?

The other thing we may need to consider, is should we be changing (I would prefer to say "resetting") the axis at 00.00 GMT every day? I think we should - just as it is my preference to close all trades before 23.59 GMT.

I hope I am not running too far ahead here Neil - but the ideas are spilling out a bit.

I'm so excited - if I was a puppy I'd be wetting myself!

I didn't realise that your correlator was so valuable - all I could see was a refined version of your avatar (which defies comment!). Suddenly - it has all jumped out at me from the screen - this is the easiest way to trade - it solves the problem of entry and exit, and brings under control that old nemesis of traders ... fear and its evil twin ... greed.

Just my opinion of course ... and I am open to be told to take a cold shower! But I think we may be opening up an edge here. Now all I have to do is train myself to read the correlator as clearly as you have managed to do Neil
 
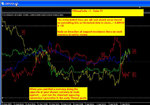
try this and please all let me know...

Hi Everyone.......

heres more thoughts re using the indicator I posted....simple stuff but has potential

set the correlator up on 1min or 5min TF's or both !

set Ma to 200and the Delta to 1.......you are now seeing virtually real time trading with no secondary MA lags between the currencies with crossovers occurring at roughly the 200mas for all currency pairs involved (yes - I like the 200ma !)

then just follow the movements of favouite Currencies looking for breakout and retrace opportunities............also add o/b o/s lines in of you want to anticipate turns in currencies (per attached).I have left the GBP, Euro,Yen and USD on this example as I like those (no offence to the aussie pairs,Swisse or Loonie !) + dropped in o/b and o/s linea at -0.00010 and +0.00010 (by eyeballing the history)

the first arrow on the left below in chart is a classic !....the Yen was overbought (tooo high) and is coming back down....on retrace then continuation of the fall sell it and buy a reciprocating currency you see (or just a basic one that usually moves against the Yen)....Euro or GBP would have provided a lovely foil to this fast trading opportunity....as far as the other arrows, I am just trying to show where trending is starting to move nicely and you could trade on the continued break throughs......

please play with it if you get time and time me give me feedback here..........

Neil
 

Attachments

  • FXcorrelator_TradingIdeas.jpg
    FXcorrelator_TradingIdeas.jpg
    77.5 KB · Views: 1,769
Thanks !

Man - this is going to be exciting Neil.

Beautiful and brilliant - how long has this been going on?

I'm so excited - if I was a puppy I'd be wetting myself!
Just my opinion of course ... and I am open to be told to take a cold shower! But I think we may be opening up an edge here. Now all I have to do is train myself to read the correlator as clearly as you have managed to do Neil

Hey Ivan

It took me about 6 months playing (on and off)) with the brilliant work that TPO and Ferru_FX had done in creating the platform for this indicator (alongside many others they have created)....I have about a hundred versions of this and even just 2 weeks ago it was not called the FXCorrelator (more my failings as a programmer than anything!)..........I like it and am glad you do to now

live it and breath it........even just getting the flow of the movements can improve your trading as you are seeing the currencies in their own world and not through 7 seperate Chart pairs that show the "Pairs" for them....in fact 1 FXcorrelator chart = 28 seperate Pair charts for same Timeframe....(!!)

Caveat - Its not the holy grail though as nothing is...but I think we can sure cut us an edge with it with everyones help !

thanks again and lay off the dog biscuits ! Neil
Neil
 
First few steps ...

Hi Everyone.......

heres more thoughts re using the indicator I posted....simple stuff but has potential

set the correlator up on 1min or 5min TF's or both !

set Ma to 200and the Delta to 1.......you are now seeing virtually real time trading with no secondary MA lags between the currencies with crossovers occurring at roughly the 200mas for all currency pairs involved (yes - I like the 200ma !)

then just follow the movements of favouite Currencies looking for breakout and retrace opportunities............also add o/b o/s lines in of you want to anticipate turns in currencies (per attached).I have left the GBP, Euro,Yen and USD on this example as I like those (no offence to the aussie pairs,Swisse or Loonie !) + dropped in o/b and o/s linea at -0.00010 and +0.00010 (by eyeballing the history)

the first arrow on the left below in chart is a classic !....the Yen was overbought (tooo high) and is coming back down....on retrace then continuation of the fall sell it and buy a reciprocating currency you see (or just a basic one that usually moves against the Yen)....Euro or GBP would have provided a lovely foil to this fast trading opportunity....as far as the other arrows, I am just trying to show where trending is starting to move nicely and you could trade on the continued break throughs......

please play with it if you get time and time me give me feedback here..........

Neil
I have been experimenting with the setting a bit Neil, and it is surprising how quickly this stuff rubs off on you.

Already I am learning which Colours = which Currency. You just have to use them a bit.

And I have worked out 2 ways to highlight the pairs I have filtered visually as having trading potential:

1) Just select the Correlator from the chart window by right clicking on it, and change the three you are looking at to a thickness of 3
2) Or instead of changing thickness - just change the colours of all other currencies to "NONE"

This will temproarily erase the unwanted ones, leaving a clear comparison of the remaning ones.

eg on the 5 min chart I have noticed the GBP has crossed the JPY, so that the JPY is above the zero line, and the BP below. So I picked which of the EUR and USD are closest to the zero, and also retained that (the EUR is sitting very close to and parallel to the zero right now). The rest I eliminated.

So It looks to me that the GBP and JPY have moved away from the zero, and at some point they "should return ... at least relative to each other, any movement will appear that way on your correlator - or should I say "our" correlator now, since you have shared it so generously with us :):)

To profit from this, we could sell the EURJPY and buy the EURGBP.

Is this something you had in mind?
It seems to me that this is an edge.

I found the same thing with the AUD and the USD using EUR as common denominator.

Now - If these things trend away from the mean (zero) for extended periods of time ... we could end up with a serious drawdown ... potentially destructive to an account. This needs to be adressed - using a stop-loss, or position size limit, so we can avoid that dreaded grim reaper, the Margin Caller!

Another way to avoid this, would be to impose a time limit.
Thirdly, it may prove expedient to set a target for the trade - eg close out at 30 pips profit. Choosing an arbitrary number of pips for profit-taking may be robbing ourselves in some cases, because certain currencies are more volatile than others, and we may miss the best moves.

Hmmm. There is a lot of work to do here.

One of the things I would like to iron out ... what is the best Delta Setting for each TF? The 5 min TF may work best with a short Delta, say 3, but the longer ones, like 30 mins may be best served with a 10 Delta.

What are your thoughts on this?
 
hey - Quick learner !!!

Hi Ivan

apologies..........not getting screen time today I had hoped...unfortunately you may have to wait till your time tomorrow as I s/be able to get stuck in after work on comments

dont pay to much heed to the Zero line (I have always debated weather to remove this as you can do it in same area of edit indicator as you can change the width of the Lines or even hide/remove them by changing colour to none etc etc )

the Zero line was much more important in the original Versions of this published by TPO as it represented the USD MA crossover line to other currencies.........in my version the currencies are totally "freeform" and relativity is simply the distance between any 2 currencies at the time.....if they are above or below the Zero it just happens to be that way !

however I have kept it in and if we can use it to generate more ideas (as you are doing) then fine !

does anyone ever remember johhny Nemonic with Keano Reeves ?.........I think Ivan is enjoying one of these moments currently !

Ivan - welcome to the Dark side...........
Neil
 
Second Steps... !

Hi Ivan

apologies..........not getting screen time today I had hoped...unfortunately you may have to wait till your time tomorrow as I s/be able to get stuck in after work on comments

dont pay to much heed to the Zero line (I have always debated weather to remove this as you can do it in same area of edit indicator as you can change the width of the Lines or even hide/remove them by changing colour to none etc etc )

the Zero line was much more important in the original Versions of this published by TPO as it represented the USD MA crossover line to other currencies.........in my version the currencies are totally "freeform" and relativity is simply the distance between any 2 currencies at the time.....if they are above or below the Zero it just happens to be that way !

however I have kept it in and if we can use it to generate more ideas (as you are doing) then fine !

does anyone ever remember johhny Nemonic with Keano Reeves ?.........I think Ivan is enjoying one of these moments currently !

Ivan - welcome to the Dark side...........
Neil
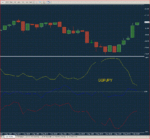
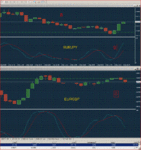
Well neil - I have sprung into action and put on a demo trade.

What do you think?
 

Attachments

  • GBPJPY_1.GIF
    GBPJPY_1.GIF
    46.8 KB · Views: 701
  • GBPJPY_2.GIF
    GBPJPY_2.GIF
    63.1 KB · Views: 654
Top