Clown's Weekly 34.

The next level down.

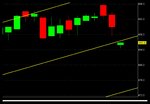
It’s not something that I expect to happen but to complete the picture as put together above the next Level down implicates an AEX close value at 473,25 today. Just so will know what the playing field looks like and it might not surprise you that our trailing stop-loss was hit yesterday and that the indicator status is Neutral, notice the lower boundary.
 

Attachments

  • AEXdag.jpg
    AEXdag.jpg
    427 KB · Views: 259
The Dutch Clown said:
It’s not something that I expect to happen but to complete the picture as put together above the next Level down implicates an AEX close value at 473,25 today. Just so will know what the playing field looks like and it might not surprise you that our trailing stop-loss was hit yesterday and that the indicator status is Neutral, notice the lower boundary.
Thanks a lot for your warning. Implications are clear.

JaneB
 
The Dutch Clown said:
It’s not something that I expect to happen but to complete the picture as put together above the next Level down implicates an AEX close value at 473,25 today. Just so will know what the playing field looks like and it might not surprise you that our trailing stop-loss was hit yesterday and that the indicator status is Neutral, notice the lower boundary.
Clown,
this may be a very special interpretation of page 58. However, if you look at figure 4-9 then the bounce really takes place (which is what we see in the AEX at the moment), but at the same time it seems to be an omen for more serious retracements in the near future.
Agree?
Pacito
 
Pacito said:
Clown,
this may be a very special interpretation of page 58. However, if you look at figure 4-9 then the bounce really takes place (which is what we see in the AEX at the moment), but at the same time it seems to be an omen for more serious retracements in the near future.
Agree?
Pacito

Pacito, the bounce for the moment doesn't seem strong enough to cross the former top at 490,2 ...
 
Pacito,

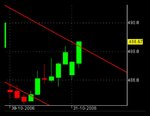
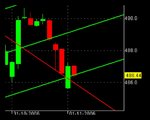
The page 58 is applicable both yesterday and today and since about everyone is looking at Positive Reversal Signals (498-503) I just point out that there is a Negative Reversal Signal (485) as well and it is a more recent signal. An other observation is that the PR targets have become lower not higher. Far more important is the change in ST trend that tells us not to exclude the downside just yet. Last but not least is the Gann 309 channel which was stress tested at the top but delivered its preferred direction and by all means remains active. We shift the focus of attention from the top to the middle of the channel for support and find that line today at 480,81. Mind you it has been a while (September 12) since we last have seen this mid channel line and the AEX has been looking for the upper side of the channel. It seems to me that a sort of help line in between can be drawn but that’s uncovered territory. So we for now stick to the Range Rules for support and confirmation.

But I have to say that I picked up some ST long positions yesterday.
 
janebowles said:
Pacito, the bounce for the moment doesn't seem strong enough to cross the former top at 490,2 ...
No, but the bounce should be 0,618 from the previous fall, which I reckon to be from 492-487, ie 3 points, so 487 + 3= 490, so thats almost what it did. What I wantes to know was, how will the index behave in the next couple of days. I fear that a test of 478 lies within the possibilities.
Pacito
 
As I wrote yesterday I also picked up okt 487,5 and nov 495. I just sold the okt 487,5 after the spike because I'm not convinced we will continue. I hold on to the nov calls.
Pacito
 
It looks like a three wave up eyeballing at it .... scaled a Gann line close to it end will use it for exit when it hits....

PS the DJIA is coming close to it's open PR target.... where the AEX isn't even close...
 

Attachments

  • AEXuur.jpg
    AEXuur.jpg
    429.4 KB · Views: 270
Week 43.

If you recall the Elliott Wave Analysis from the last two weeks the AEX performance of last week added to it provides us with a preferred scenario (note 5: starts at 460,17) that wave 5:3 and 5:4 have been set and we are now completing wave 5:5 in a Extension5C or ImpulseC pattern. Time wise the first hit for wave 5: is October 26 and the next November 23 and the to the above patterns related price extension indicates >519,54. And this means that the 5: subwave labeling as found above preferred 5:4 becomes a question mark that requires some extra attention. The complete the whole picture it must be mentioned that the complete wave as Extension3C is a possibility although it presently is not the best fitted and confirmation implies lower price values.

Furthermore the last weeks Short Term trend change (from + into -) the confirmation of the change and even a second confirmation is an other indication of the 5:4 wave not being placed yet. Mind you the MT and LT trend are still positive and in order for those to change we need to see serious lower AEX values. With a little bit of help from the Elliott legacy we will find an open wave four pattern that for now leaves us with two possible scenario’s. Not too dramatically downwards more a sort of trading range with limited price potential and depending on the continuation it is the question whether or not the 486,78 will be met. Early this week we should have more insight as wave 5:4:4 shows its merits and indicate which pattern continues. Guess what if we look at 5:4:4:3 we already have a favorite but let’s not get ahead of things at this stage.

If you recall last weeks favorite indicator findings of the AEX and DJIA they were both in the Overbought status and in sync we must now conclude that they are out of sync because the DJIA did not leave the OB area where as the AEX found safe haven in the Upper Range. So are we going to discus the leading index arguments here once again or are we going to make some money next week, if you don’t mind I will do the last.

Last week the AEX was trying – okay it was above the channel for one day - to exit the Gann 409 channel at the topside whereas the DJIA 10683 channel did meet the channel topside last week but did not exceed it. I have to say again well done mister Gann you have provided a set of excellent tools although I have seriously doubted the AEX channel last week I now have to conclude WOW. If mister Bush will allow a bit of relief so the DJIA will come of it’s all time high a bit or does he want to play it on the safe side. Don’t forget the DJIA Positive Reversal Target which is so extremely close even with the limited favorite indicator potential.

Is has been a while since I did look at the Astronomy simply because it is a lot of work and I am still figuring out how to integrate the lot with less extensive workload. Let’s just remind that the last October weekend Mercury turns Retrograde for three weeks. Take a closer look at the Mercury Jupiter opposition that occurred 24 times in my AEX January 1985 – October 2006 data file. The largest (14om10 is 58,3% max win 13,63% max loss 3,18%) upside potential is found 26(OB)-28(CS) October and 4-6 November with two more in December. The largest downside (16om8 is 66,7% max win 14,05% max loss 5,0%) potential is found 16(OS)-21(CB) October and 25-30 October and again a couple in December. There is also a risk optimized trading set up to be made in which the bull version had a 70,8% (17om7) positive hit rate and the bear version a 66,7% (16om8) hit rate. If I take a moment and let all of this rough data sink in I definitely will have to find a way to get this work done it amazes positively me each and every time.

So we started this bit nice and easy and when we are coming to the finish of this update we are going to do it rough.

Have Fun trading to Win.
 
@TDC

The astronomy dates are a little bit tricky, because 26-28 Oct go's long and 25-30 Oct is a shorting.
When 1 happens ,2 can even happen too, but its tricky.

Regards,
 
The Dutch Clown said:
With a little bit of help from the Elliott legacy we will find an open wave four pattern that for now leaves us with two possible scenario’s. Not too dramatically downwards more a sort of trading range with limited price potential and depending on the continuation it is the question whether or not the 486,78 will be met. Early this week we should have more insight as wave 5:4:4 shows its merits and indicate which pattern continues. Guess what if we look at 5:4:4:3 we already have a favorite but let’s not get ahead of things at this stage.


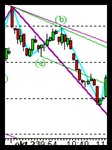
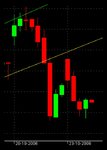
The performance of the AEX this morning urges an other more negative pattern which implicates that the "trading range" will be left downwards. The above 5:4:4:3 has a different preference: 5:4:2 so the third wave is down. The attachment shows 5:4:2: a and b(green). Please note that this is extremely close to the actual thing so changes are frequently in order.

EDIT: attachment 2.
a picture is 1000 words.

EDIT:
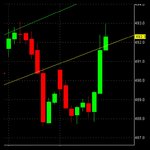
Pats; that was the DJIA PR target.

EDIT: attachment 3.
It's going to be exciting. ech nie

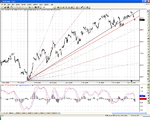
EDIT: attachement 4
oeps what is this?
 

Attachments

  • aaa.jpg
    aaa.jpg
    97.9 KB · Views: 274
  • AEXuur.jpg
    AEXuur.jpg
    86.1 KB · Views: 278
  • aaa.jpg
    aaa.jpg
    124.4 KB · Views: 232
  • aaa.jpg
    aaa.jpg
    32.1 KB · Views: 259
Last edited:
The Dutch Clown said:
EDIT: attachement 4
oeps what is this?

Clown, this is the answer to all those who think it should go down. There are still to many hesitators. They will be dragged into the winning mood before it really goes down. Strike and let the mass behind in awe.
Two words you're not supposed to use are **** and oeps. Both are an expression that you did something wrong. Let's say it wasn't quite optimal. I had a teacher who said:"We only do things good, very good or excellent." In this case oeps means that you did good, but nobody will understand that. So, its better to say good, meaning oeps.
Pacito
I noticed that there is a censor at work, replacing my word by ****. It was something produced by dogs on the street, you would rather not step into.
 
I'm also trying with Gann and so ond. I read the original gann document about gann angles. So I tried to put on from 460.1 with1 point x 1 day ( 1 x 1), or can I only do that in the day graph? I get the lines other than you (see attachment). What am I doing wrong?
 

Attachments

  • gann_AEX_46017.PNG
    gann_AEX_46017.PNG
    102.8 KB · Views: 258
Qwerty321 said:
I'm also trying with Gann and so ond. I read the original gann document about gann angles. So I tried to put on from 460.1 with1 point x 1 day ( 1 x 1), or can I only do that in the day graph? I get the lines other than you (see attachment). What am I doing wrong?
I don't know to which thumbnail you are reffering. You can use Gann in every timeframe you want to. But its important to realize that 1 point 1 day is not always right. First you have to find out the rythm of the index or the share. Then you adjust your lines. You can take 1 step or 2, 3, 4 or 5 steps. I.e. 5 points a day, or 0,5 points a day. I know you start with the standard, but that belongs to the "default club".
Pacito
 
Thanks! Am I right that you can also put it at a important bottom or top (from the point where you draw it then)
 
relax man I know I did.

Last couple of days I have spend with the family in a nice Hotel at the Disney Resort in Paris so I did not make my weekly roadmap study. I have to turn to the famous KVKD system which indicates more risk at the downside to come and given that more laid-back system I am not going to hunt down the limits this coming week.
 

Attachments

  • AEXdag.jpg
    AEXdag.jpg
    162.6 KB · Views: 279
Dear Clown,

Nice double top at Eurostoxx50 future and nice pull back until 4040 ? Another chance to make short money?

KVKD
 
Mr Cold or Warm,

This morning my dsl was down so I had to fix the data in order to complete the KVKD system short term. And what you see is what you get it is critical for the short players right now so look at your Range Rules. And also notice the present page 58 movement.

I play the AEX as you know.
 

Attachments

  • AEXuur.jpg
    AEXuur.jpg
    69 KB · Views: 257
Last edited:
It’s a story about Bulls and Bears combating.

The ST trend according to the GJN taught methodology is still negative and the pullback of the move downwards was a typical page 58 scenario which concluded by leaving us with a Negative Reversal Signal. The KVKD system allows a more closer trend identification and provided accordingly a 484,32 started uptrend by leaving the 495,73 down trend yesterday morning. This morning we find the two trends crossing and that implies a decision due shortly. (right now actually)

The opening this morning found support at the 460,17 Gann Fan 3x1 line which did the trick at 484,32 previously but I have to admit that rescaling has to be done. Yesterday in Yank’s Land the DJIA did confirm its ST positive trending and even produced a Positive Reversal Signal with target just above 12400.

Finally if you recall the week 43 Mercure-Jupiter conjunct influence the bears are about to resume their static position and will have to wait until the next opportunity. It is with somewhat astonishment that I watch cowboy Billy George walk(er) through this Bush.
 

Attachments

  • AEXuur.jpg
    AEXuur.jpg
    76.4 KB · Views: 254
  • AEXuur.jpg
    AEXuur.jpg
    109.9 KB · Views: 267
Top