Clown's 2007 outlook is work in progress

Sunglasses on ?

Dear members,

Quite a "colourfull" discussion here. In the haunt for The Holy Grail there are going to be more and more colours, lines and whatever. Be carefull not to loose sight on the most important thing, where is the market going.?

Kindest regards

KvKd
 
starting points

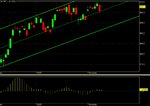
In order not to lose sight of what is happening, a few thumbnails. In studying the marvelous attachments posted by the members of this thread, I tumble into fractals of fractals of fractals. I end in a rollercoaster of signals and by the time I read and understand them, the situation has changed already. Since I don't have the time to sit behind my computer all day long, I have to trade a longer timeframe. At the moment the swing per month is about 30 points, per week about 15 points and per day about 5 points. Swing means end points, regardless of the trend. So its quite possible that the AEX after 3 months is still at the same level. Why would this be interresting? Because of the lack of time I mostly short options both sides. And that at a minimal risk.( in my opinion) So I combine longer term options p.e. short c oct 460 and short p oct 440 with short c feb 515 and short p feb 495. In this way I don't have to act on every move up or down. Nevertheless its important to anticipate on the direction. In the uptrend, keeping in mind the 30 points swing per month, I can take a 10 points downswing and a 20 points upswing. Take into account the fact that down is faster than up, I can change this to 15 points down and 15 points up. In a downtrend this can change to 5 points up and 25 points down. Or, when the indicators all point in the same direction and the trend can't be missed even by blind mice, I will buy back the loosing trade and even buy options. That has only been the case in mai and november.
For the moment the trend is still up. However I keep in mind a correction in the coming 6 weeks. ( see my posting on aex this year at the beginning of this thread.
Pacito
 

Attachments

  • aexm1.JPG
    aexm1.JPG
    163.2 KB · Views: 223
  • aexm2.JPG
    aexm2.JPG
    152.9 KB · Views: 195
  • aexm3.JPG
    aexm3.JPG
    130.6 KB · Views: 211
  • aexm4.JPG
    aexm4.JPG
    110.8 KB · Views: 189
  • 2007.jpg
    2007.jpg
    407.2 KB · Views: 210
Last edited:
Er is ook nog wel wat anders dan de beurs hoor.

Pacito,

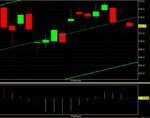
From a year’s outlook point of view the anticipated moves are yet to come so I moved to the fractals within the trend to define trends within the trend or perhaps trading range if you like but rather I would like to see them as wave degree’s or levels as in the Elliott approach. The 496,62 KVKD + trending area system was left last week and on Friday the AEX tried to return into it without success so I have scaled a new 509,88 KVKD – trending area system for the next moves.

A couple of levels higher I consider the 498,45 and 470,54 as the most relevant pivots and still keep the second wave option open based on the time relationships. The divergence combined with open Positive and Negative Reversal complete that picture and it provides a plausible explanation for the hesitation moving upwards. Looking at the derivative oscillator in the EOD chart might be an other way to capture the pause and help to get it into perspective. In last weeks contribution I shared a number of different angles time wise which will have to come through shortly if applicable in this run.

If you look at the hourly chart you should be aware of the active Negative Reversal even though this is influenced by the corrupt opening on Thursday. And if I use my own version of the dynamic RSI on the same timeframe (mind you GJN in his column does use other timeframes) for the GJN taught trending methodology it has changed from + to -. Let’s for the fun of things look at what my own dynamic Range Rule RSI does for the trending identification in the EOD chart, well I would say that’s something else. The Slow Stochastics together with the non default club settings Stochastics complete the picture and it looks pretty much like a MESA reversal.

Due to the birthday of my youngest son I was out of the office for a couple of day’s and this week will also be shortened a bit even though I am trading for a living I do not spend my whole day’s looking at my computers. And trying to download data on Sunday runs into admin problems at JAAD who charged my credit card for data but forget to deliver an other reason to phase them out completely as soon as possible.

Have a good one.


EDIT:
Same chart as the first including today’s data so far, U: check; P: looks like it; G: oeps.
 

Attachments

  • aaa.jpg
    aaa.jpg
    218 KB · Views: 238
  • aaa1.jpg
    aaa1.jpg
    117.3 KB · Views: 242
  • aaa.jpg
    aaa.jpg
    177.2 KB · Views: 216
Last edited:
There's a hole in the buckett dear Henry, dear Henry...... Seeking strength, but the trampoline is weakening..... We've seen this before, it's a trap.
Pacito
 
Vergeet niet de "zekerheidjes" op te rapen.....

You can call it a Trend or a Swing or a Fractal or what ever you feel comfortable with but what are you talking about anyway other than winning or losing money. Yes the uptrend starting March 2003 is still valid but are you going to wait until it isn’t anymore with long positions? Dacht het dus niet.

Action is reaction is the physics law I have learned in high school anticipating is what I have learned at the lessons for my driving license. In my working carrier I have learned that one can obtain a specific reaction by performing an defined action. In trading I combine the lot and make money. By all means let’s help our friend with his uptrend and define where he should reposition by applying his very own trending methodology but with some help of the new dynamic Range Rule RSI on the used timeframe. (see attachment 1) Well what can I say, it takes one to know one.

In the mean time my 509,88 KVKD - trending area is making money and also the same rules apply which tell us that in a down trend the resistance levels are the levels to watch. And with the help of all my friends we even can do better. So the second attachment really tells this part of the story.

Just Trading to Win.
 

Attachments

  • aaa1.jpg
    aaa1.jpg
    211.6 KB · Views: 231
  • aaa.jpg
    aaa.jpg
    112.8 KB · Views: 233
fractals in space

Dear Clown,
Again I am troubled with the rules of priority ref. earlier posts, given the older PR and todays NR. For the moment I tned to look upwards, but careful. For the rest I am curious what Mercurius will bring the coming weeks. Maybe you could post the "clownindicator" once more?
br. Quick
 
op aarde gewoon een lekker bubbelbad....

Quick,

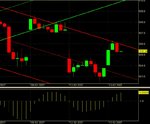
The Reversal Signals occur in time and within a timeframe I would suggest to look at the most recent at the shortest timeframe first. Next I would suggest you take some time and perform some re-engineering on the different signals so you will get a better feel for what is and what isn’t realistic. Far more important though are the suggestions I gave you last time you asked. The most recent signals happened at the resistance line of the 509,88 KVKD – trending area some people would see this as the P of the UPG. It is no 100% guarantee that the signal will stick however there are a number of clues that indicate in favor of the signal. Most relevant no matter what, is that if you entered just above the resistance line this morning you will be ending up with an other trade to WIN. Now go back to the chart where you have found the most recent reversal signal, what do you sense, coincidence?!

As mentioned in one of the above posts the relevant Clowndicator signal for a while occurred last week-end on the 10th of February so that would indicate a turn down. Currently I am revising the programming code and fine tuning the design a bit, once I wrapped that up I will probably update it. Also have an other look at the inter wave relationships I calculated recently the combination of the two makes it powerful.

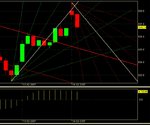
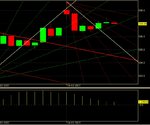
Notice what the AEX has done with the top side of the 509,88 KVKD – trending area system today, I have attached the updated second chart of this morning which includes the chapter 14 indicator in the book. The oscillator should tell you right now how to explain the flirt with the resistance line. An other piece of the puzzle you will find in attachment 2 it did strike me that this home made oscillator has a tendency to become neutral before a next relevant move in price.

Have Fun.

EDIT:
Quick take a closer look at your 16:00 bar.... what do you see?!.... how is it called?.... look at the same chart at the DJIA.... what do you see?!.... how is it called?.... easy does it
 

Attachments

  • aaa.jpg
    aaa.jpg
    204.4 KB · Views: 228
  • aaa1.jpg
    aaa1.jpg
    199.5 KB · Views: 230
Last edited:
fat lady may sing like a mockingbird...

yesterday's PR's on both S&P and DJ are not to be neglected for the short term
 
violations - waar is m'n bros?

as a consequence of the above this mornings NR has been violated at 16:00 hr (hourly chart) , and should therefor be negated, .....ahum......violation does not apply at moment for shorter timeframes......
 
Last edited:
bars and bros

Dear Clown, I just noticed your edited remark. I am not sure I understand what you mean. If you refer to japanese candle patterns, I notice the start of a Rising Three Methods , which is a bullish continuation pattern with high probability. If this is not what you mean, plse fill me in. NB: the above violation I meant , was not on the 16:00 hr, bar , but the previous one ending at 16:00 hr.
Br. Quick
 
Geld stinkt niet maar ja u moet er wel wat voor doen.

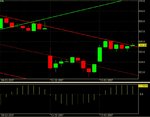
When trading to Win one has to obey strict rules and exit when appropriate so when the AEX left the 509,88 KVKD – trending area system that was my call to exit. Even when the 15:00 bar formed a Negative Reversal together with the DJIA but the Dow had some more potential left. From an entry point of view it lacked support of other techniques. Looking at the DJIA charts right now shows an interesting picture so it’s up to the AEX.

From the GJN taught trending methodology it will be interesting to see what the short term timeframe will be showing. The short term trend remains negative and even within the boundaries of the dynamic Range Rule RSI. The derivative Oscillator is showing divergence and you should definitely have a look at the derivative oscillator in the DJIA. The playing time for the small sized trader is over and just look at your charts to see what we have left.

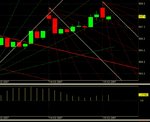
It has always been my objective to find techniques that work in each and every market and timeframe so I have scaled two Gann Fans on the most recent pivots that will provide trading signals even outside the KVKD trending area’s. And don’t forget about the reversal present.

Mind you Quick mentioned Mercury and for a reason since it’s Retrograde for the next two weeks and astrologists would point out that Technical Analysis would not work according to the normal rules. Resistance and Support would have less to no relevance according to the Astrolo -gist which differs from the -mist.

Have Fun.


EDIT: onderbroeken lol
same chart data updated....

EDIT2:
This is the toughest ballgame I have seen in quite some time. Three bears out, but the game is still not over, the bulls are at the plate; one man out and this second one has difficulties written all over him. Before you consider long positions have a glance at the DJIA hourly chart both Fast and Slow Stochastics. And while you are looking at charts don’t forget the eur\dol ones.
 

Attachments

  • aaa.jpg
    aaa.jpg
    241.1 KB · Views: 237
  • aaa.jpg
    aaa.jpg
    232.9 KB · Views: 227
Last edited:
wat nou trend vergeet nou niet wat zakgeld op te rapen

A trend is a friend and if one is in desperate need to see 512 the so called trend is up, the somewhat more objective observer notices something that one from a Technical Analysis perspective usually refers to as Trading Range. The even more critical watcher notices that time is playing a role as the AEX does not move upwards for weeks and weeks now. So rather than hoping or reacting I prefer to make some money simply and each and every day so I need not explain what my action was this morning.

Attached you will find the most recent trading set up for the trades to win. Will this one survive a bit longer than the previous ones, I don’t know in fact who cares proving the entered trade is a winning one again. The name of the game is entering at the right point and following the position with a trailing stop loss.

Have a nice weekend.


EDIT: BB

Pacito,

The Bollinger Bands have not yet been studied to an extend that I feel comfortable with so I stick to the tools I did study. However if you consider what enveloping (Bollinger is just one of the flavors) in fact is you immediately notice that a narrow envelope is caused by what might be best described as a trading range. And guess what a trading range at some point in time will be left, what I would now need to know is the objective signaling that tells me where and when this range will be left. And this is the point where my enveloping knowledge is insufficient.
 

Attachments

  • aaa.jpg
    aaa.jpg
    277.8 KB · Views: 227
Last edited:
I saw an interesting remark somewhere. When the bollinger bands are narrowing to a certain point there's gonna be a significant move. Is there anyone who uses this. Could this be a useable sign?
Pacito
 
Last edited:
Pacito said:
I saw an interesting remark somewhere. When the bollinger bands are narrowing to a certain point there's gonna be a significant move. Is there anyone who uses this. Could this be a useable sign?
Pacito

Dear Pacito,

Using the BB in the chart of the index and also the BB in the RSI (Dynamic RSI) , my conclusion should be that it happens sometimes but not reliable.

Regards

KvKd
 
cold or warm said:
Dear Pacito,

Using the BB in the chart of the index and also the BB in the RSI (Dynamic RSI) , my conclusion should be that it happens sometimes but not reliable.

Regards

KvKd
I looked at a fair amount of data and the fact that struck me was that a narrowing of the bollinger bands with the price at the upper band almost always resulted in a sharp decline.
I didn't take the bollinger bands in the RSI because that seems to much looking at the same thing. The reason I started this was my inability of determining the direction of a sudden change.
Pacito

2 By the way, did anyone notice the 144 bars in the first attachment? These are trading days. In this second attachment I show calender days, 206 between tops, thats about 144 trading days. Remarkeble isn't it ?
 

Attachments

  • bb.jpg
    bb.jpg
    371.8 KB · Views: 1,581
  • 206.jpg
    206.jpg
    338.6 KB · Views: 172
Last edited:
Pacito said:
I saw an interesting remark somewhere. When the bollinger bands are narrowing to a certain point there's gonna be a significant move. Is there anyone who uses this. Could this be a useable sign?
Pacito

Yes very much so in my opinion.

Use it with MA5 10 and 20. When upper or lower BBand is broken and price is above MA lines or below respectively is a good indication of brake outs.

You can get bear and bull traps but on the whole it's a strong very useful indicator to a move when it narrows.
 
Pacito said:
I looked at a fair amount of data and the fact that struck me was that a narrowing of the bollinger bands with the price at the upper band almost always resulted in a sharp decline.
I didn't take the bollinger bands in the RSI because that seems to much looking at the same thing. The reason I started this was my inability of determining the direction of a sudden change.
Pacito


Any decent oscillator can reveal the possibility of a sudden change. Have also noticed that when price is near or above/below the narrow BB you can get a false breakout then the expected reversal.
 
Pacito and other dear Gentlemen,

Investors who have met the down periode in the begin of this century, are very keen on sudden downfalls. Pacito marked with 6 arrows, 6 times an down in the market. But...and that was my conclusion, it is a touch of the band. Together with the RSI and the "Poweeerrrr" range rules, it is a nice tool to trade.

KvKd
 
cold or warm said:
Pacito and other dear Gentlemen,

Investors who have met the down periode in the begin of this century, are very keen on sudden downfalls. Pacito marked with 6 arrows, 6 times an down in the market. But...and that was my conclusion, it is a touch of the band. Together with the RSI and the "Poweeerrrr" range rules, it is a nice tool to trade.

KvKd
You're absolutly right. However, there are more touches of the band without a downturn. Anticipating touches can be very costly, so I thought to minimize the false ones. Of course I agree with you that the combination with RSI, range rules etc. is important. But every little extra that minimizes losses or add to the winning trades seems important to me.
Pacito
 
Pacito said:
You're absolutly right. However, there are more touches of the band without a downturn. Anticipating touches can be very costly, so I thought to minimize the false ones. Of course I agree with you that the combination with RSI, range rules etc. is important. But every little extra that minimizes losses or add to the winning trades seems important to me.
Pacito

IMO touches to the BB are not significant. This is because price and the BB can both rise considerably ballooning out.

It is more the narrowing of the bands towards a narrow tunnel followed by a brake out of the BB also confirmed by MAs and crossovers of MAs that is a strong signal. This move is only significant when it is braking out of a narrowed range.

MACD, RSI & Stochastic indicators can then point to if price is extended up or down.
 
Top