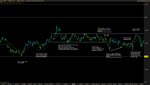
Well, today was the biggest day for me in terms of pips (although I'm paper trading and I realize days like today aren't the norm).
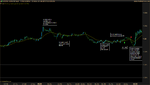
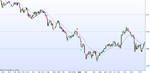
I did notice some of the same setups as you guys. I personally took 4 trades, 3 of which worked out. I do believe that I got a little lucky on two of those:
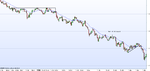
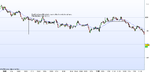
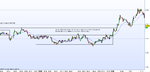
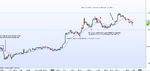
1. in the first chart I don't know if that was a proper SB
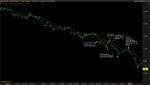
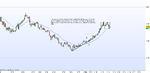
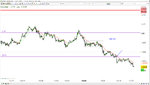
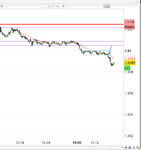
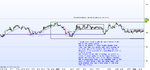
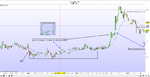
2. In the third chart, I took something that looked kinda like a DD setup although I'm not quite sure of what it really was.
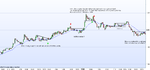
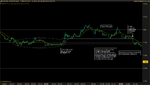
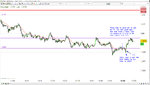
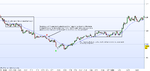
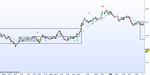
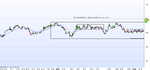
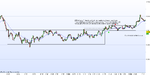
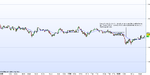
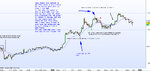
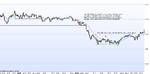
BLS : I only saw the first setup that you posted, the second one seemed too choppy. On the first one I didn't trade because to me the overall pressure wasn't very clear (just 30 mins before the entry point the trend was somewhat up...). I'm still having trouble evaluating these overall conditions. I see Bob trading sometimes in opposite direction on the same chart (that is in a span of 1h). I usually "pick one side" (not bias, but just the side that gathers the most elements to it : stronger bottoms, reversal / continuation patterns etc) and wait for it to reverse completely before taking a trade in the other direction.