samich1262
Well-known member
- Messages
- 293
- Likes
- 3
BLS, I read this chart almost the exact same way today, which makes me feel like I'm getting on the right track.
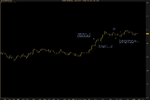
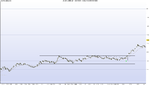
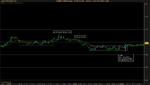
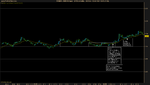
Going over the charts Bob has sent over the past few weeks, I notice some bear flags that don't have a BB, SB or DD entry that I can tell. It looks like on a few (and only on very clear bear flags) he may have just traded using the trend line. Is this right? On the less exemplary flags it looks like he waits for a BB. Ex. chart 3 in the latest batch. There's a couple others in the first 2 weeks too like that. I actually saw that flag last week but I skipped because I thought I needed to wait for a BB to develop at the end, but I saw him do that on week 39 too. Flags are pretty popular, maybe enough people jump on them to warrant taking them if they're clear enough.
Going over the charts Bob has sent over the past few weeks, I notice some bear flags that don't have a BB, SB or DD entry that I can tell. It looks like on a few (and only on very clear bear flags) he may have just traded using the trend line. Is this right? On the less exemplary flags it looks like he waits for a BB. Ex. chart 3 in the latest batch. There's a couple others in the first 2 weeks too like that. I actually saw that flag last week but I skipped because I thought I needed to wait for a BB to develop at the end, but I saw him do that on week 39 too. Flags are pretty popular, maybe enough people jump on them to warrant taking them if they're clear enough.