cha-ching
Active member
- Messages
- 148
- Likes
- 9
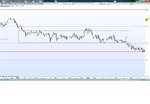
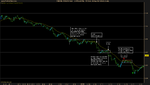
Nothing wrong with this trade I'd say.
The pullback was a little deep. I counted 13 bars out of 20, 65%. Otherwise it looked good.
Nothing wrong with this trade I'd say.
@cha-ching
I can't pull up your attachment. I get the error message:
Invalid Attachment specified
@cha-ching
I can't pull up your attachment. I get the error message:
Invalid Attachment specified
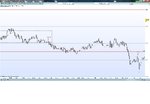
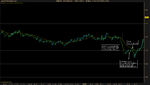
Hmm that's weird. I can see it. I almost took this as a DD but didn't because of the higher low, but maybe I should've because overall conditions were favorable.
I don't know that the tiny higher low should be feared in such a bearish move. Maybe if it were more significant, but it was tiny. It looked unlikely that price could climb back into the range easily after that, and the 2nd doji was pushed back under the average quickly. I'd say conditions win out in this case.
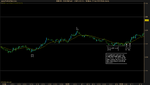
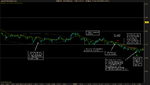
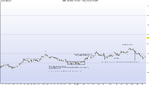
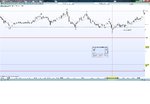
How did you like the missed RB? I read in the book that when market is slow one should use absolute high/low as barrier, but the one below 20 was obviously a false one so I moved it to 20-level. Then I was trigger shy when price broke.
I saw this more as a BB and took a chance on it. I was worried about the 50 level but other than that, everything else was good. We had clear downward pressure, no visible chart resistance, and we had good build up and squeeze.Trades today:
I missed that RB. At the time I drew the lower boundary at 20-level, so the squeeze looked not as good as shown and I hesitated.
SB: I was aware of vanica's comment on second thrust higher than first pullback high. In fact I did look at all SB trades in the book and found only two cases: Figure 9.4 and Figure 9.5 (2nd SB). In this case it went 3 pip higher, and there was a gap before that. However when I saw price quickly go back and close dead-end below 20ema I pulled the trigger. Maybe I shouldn't have, but this is my first winning live trade with 9.9 pip gain :clap:


I saw this more as a BB and took a chance on it. I was worried about the 50 level but other than that, everything else was good. We had clear downward pressure, no visible chart resistance, and we had good build up and squeeze.
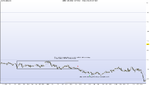
I saw this more as a DD. I was distracted at the time so I didn't notice it break but I think it was a good trade. You've got a nice clean breakout and a pullback that retraces almost 50% of the move, right into the 20EMA. It's a nice bonus to see price prick that 20EMA only to be quickly pushed back down.That pullback would've made me a bit paranoid though, even though it shouldn't. I think it's takes some aggression/confidence to try to take with trend setups after a fresh breakout, especially when we've seen (or perceived) a lot of them to fail.
@cha-ching
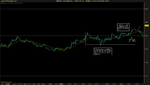
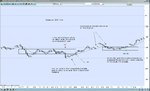
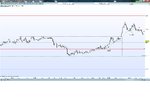
I like your "RB" as an IRB. I can see 3 arches in it which is a good pattern for IRBs.
I see your "SB" as an FB. It's the first pullback after a breakout of sideways consolidation. You had that one false break in the retrace up but it wasn't at the ema so I don't count it. It looks similar to 8.1 pg 64. Also See 8.4 pg 71 - it had a very tiny false break in its down leg to ema but still an FB.
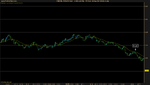
Regarding your E1, I had the same box drawn but I missed the entry b/c I wanted to set an alert by EMA, but I set the trigger price too close to the barrier and wasn't fast enough to pull the trigger. I found that keeping your eye on the screen during a range can be stressful. Just one question for you: what is the technical ground for you to move the tipping point up after that higher high at 1.2892?
Thanks for the explanation BLS. I have another question regarding Bob's way to move tipping points. It appeared several places in the book but let's look at this one: Figure 14.1 on page 250, number 2 and 3. On page 252, at the end of the first paragraph Bob wrote: "the moment the bar of (3) took out the high of (2), the protective stop was lifted to the level of the ullback low (black line)".
My question is that until the bar of (3) closes we don't know whether (2) will become a mini-swing low. (3) could've taken out high of (2) first, then dipped, say, 2 pip below the low of (2), i.e., (3) becomes an outside bar of (2). In that case the trade would be exited prematurely.
Now if we should wait until (3) to close, and then (2) indeed becomes a swing low, then at what point should we move the tipping point to low of (2)? If high of (2) has not been taken out by (3) then we wait for that to happen; but what if it is indeed taken out by (3) but (3) closes lower than the high of (2), should the tipping point be moved or not?
Another example is Figure 14.5 on page 257, 7 takes out high of 6 (Bob's explanation at the bottom of page 259).
I found that keeping your eye on the screen during a range can be stressful.
Make sure you are sitting comfortably when watching the charts.
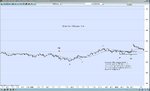
Looks like I still have trouble showing some aggression in a good trend. I still managed to catch 10 pip today though. At least I didn't trade recklessly trying to "make up" for those missed pips, which I have done in the past, so I consider this a good trading day.