shotgun77
Active member
- Messages
- 128
- Likes
- 2
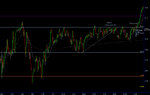
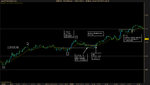
Sceenshot n. 7, between 9:36-9:39, there is a clean diagonal pullback from white dojis. It doesn't retrace too far, but not that little either.
I see what you mean now. I don't know.
Sceenshot n. 7, between 9:36-9:39, there is a clean diagonal pullback from white dojis. It doesn't retrace too far, but not that little either.
Let me raise a question: how do you manage your old charts?
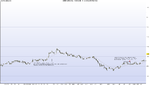
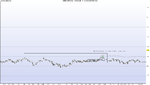
I save them in OneNote, I make screenshots with freeware capturing software called PicPick and I merge the charts together so the result is one wide picture of the whole day. It has some disadvantages, but I didn't come up with anything better. I'm interested if someone found a better solution.
Let me raise a question: how do you manage your old charts?
I save them in OneNote, I make screenshots with freeware capturing software called PicPick and I merge the charts together so the result is one wide picture of the whole day. It has some disadvantages, but I didn't come up with anything better. I'm interested if someone found a better solution.
Hi,
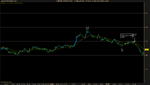
Would you say the top barrier was a bit unclear for the majority of traders to provide follow through on it's break?
Thanks.
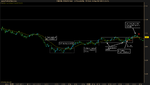
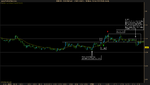
Hi, in my opinion you made a right call by skipping that BB:I think I missed a BB early on the NY session but I'm not too sure. It looks a bit like Chart 22 from the charts Bob sent us but the retracement is only about a 1/3 of the trend move.
Hey BLS,
I had my eye on that flag/BB too but skipped it because of the resistance to the left. Although, it looks like it had enough room to move most of the way to the target without hitting major resistance, so it could probably be traded if you trailed close.
There was an RB during lunch hour but I missed it. I wondered about low volume on days like today, so I tend to skip a lot of setups. Although if they are built up properly, then a lot of them still seem to work out. Do you think that Bob would worry about that? There's one place in the book where he says during slow market hours he'd prefer a little more squeeze on RBs and such. If it has enough pressure would you trade it? Seems like I mostly only see BB and RB related setups during the afternoon US session and Asian session.