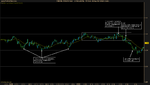
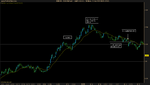
This chart is from 2 days ago. I thought it was one of the more difficult sections to trade on-the-fly so I decided to post it and see what you guys thought of it. First, I marked IRBs but they are by far my weakest setup, so if they look bad to you, let me know! But overall, the 2 IRBs and the BB are basically the exact same move over and over again. It's very repetitive.
IRB #1 is part of the shoulder of a sort of Head & Shoulders pattern that you can't really see on screen. The ARB was a 2nd entrance. Then there's the BB that says "skip this." A tight BB full of dojis like this might be okay in a stronger trend. If I take a BB at the top or bottom of a trend, it's got to be short and all doji's.
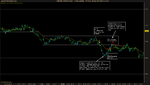
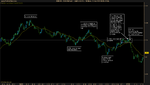
IRB #2: Volman says in the book that a lot of times we assign more value to some obstacles than we should. I was scared of that double bottom at 1.301 (maybe even considered to be a triple bottom by some) but overall pressure was down and that IRB had 10 pips to work with. I looked more at the DB than the context. But I thought that trade stood a good chance to work out because it was basically a failed breakout after a triple top. I almost traded it but decided to watch since IRB's are my nemesis right now! Haha...
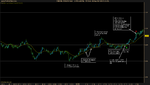
You could probably draw a box around that price action from 5:37-6:12. In fact I think I actually traded that as a BB for a loss that day. Then there's the 2nd BB labeled Skip This. If you read my last post, you probably saw that I am skipping all BBs on the outside of a range break because I think it resembles a failed breakout and has a good chance of climbing back into the range. At least lately, I have not seen hardly any of them make it 10 pips. Maybe with a longer pullback, but not like this. The break out of the range just didn't look solid enough to me. You could use that BB setup as an aggressive trailing opportunity if you took the range break though.
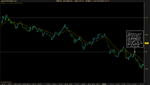
After that, there's a beautiful pullback which is almost sure to be countered. It uses that previous price action that I labeled as an IRB for support. I probably should have viewed this as some sort of range break since it crawled back in the range. Pressure is more clearly bearish at this stage.
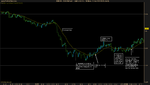
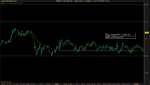
I don't know if I'm just paranoid about IRB's, but I would rank the most conservative trades on this chart as the 1st ARB and the BB on the far right.
Let me know if you guys saw anything else on this chart or saw anything differently. I am really trying to work on my analysis so that it becomes automatic. I take too long to gauge IRBs in the live market and find that I don't take hardly any setups that aren't either trending or proper RB's. I think that will change with repetition.