Beyond Price Action

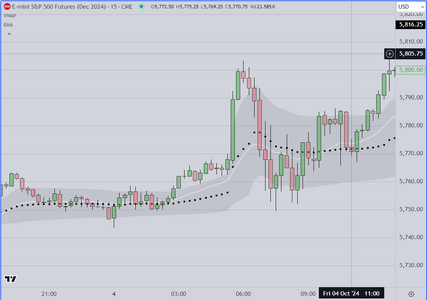
Chart Markup for Friday 10-4

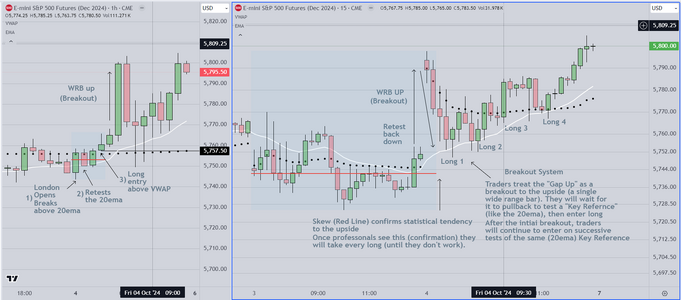
ETH Markup (Left Side)

Left side shows hourly candles and ETH time frame
As can be seen plainly, the skew (red line relative to the
VWAP) is to the upside. Evaluation starts at London Open.
Price trends up, retests back down to the 20ema, then breaks
back up past the VWAP. Long entry at 2am PST US time would
have resulted in a significant winner

RTH Markup (Right Side)

On the right side, 15 min candles. Same premise, during ETH price
gaps up. Traders interpret this as a single wide range bar (WRB)
They wait for a pullback to retest the 20 ema, and then buy every
retest. This pattern (repetitive tests of the 20ema) occurs about 20%
of the time, once traders identify it, they will continue to trade it from the long
side, until it fails. On this occasion it was successful to the end of
the session.


Final Note

The objective is to develop a system whose statistics can be known and
traded reliably. Today's price action was unusual. It is more common for
breakout setups to fail (about 75% failure rate is common) and so we
look first for the short side. If as seen on today's chart, we see a trend
from the first pullback, AND the skew is in agreement, traders will assume
that this may be a trend day (only about 20% of days consistently trend)
They will monitor the first trade, then continue to take longs until they
fail.
 

Attachments

  • Friday 10-4-2024.PNG
    Friday 10-4-2024.PNG
    147.9 KB · Views: 25
Last edited:
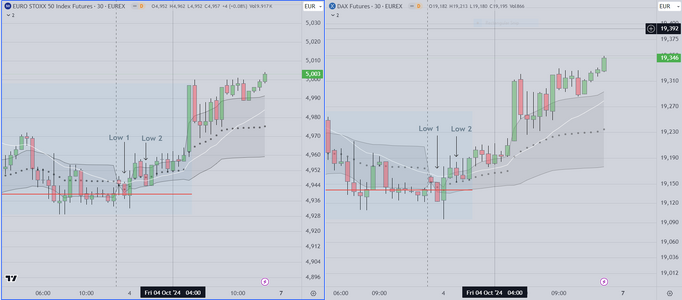
I wanted to post the DAX and FTSE
for folks who trade those contracts
Clearly there is a high correlation between these contracts
Also wanted to show a couple of well known setups. These
are called "Low 1" and "Low 2". The basic premise is that
if the market tries twice (unsuccessfully) to move up or down
that triggers a setup in the opposite direction. As can be seen
taking that setup and holding, results in a big win
High & Low 1 & 2 trades are some of the most reliable setups
that I teach (for Euro Traders). Traders are taught to identify this setup
early in the session and hold, especially when the "skew" agrees.
 

Attachments

  • DAX & Footsie.PNG
    DAX & Footsie.PNG
    109.7 KB · Views: 8
Last edited:
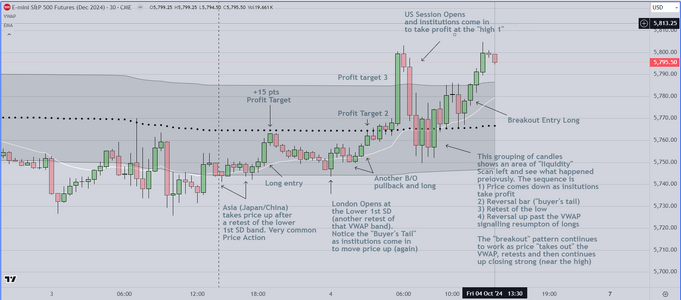
The Importance of Recognition

One of the primary lessons I teach is recognition. Price action is a puzzle
and as each session opens, traders have a limited amount of time to solve it.
Skilled professionals apply the same framework that institutions use (the VWAP envelope)

1) Assume that on a given day, institutions have proven trading plans that
will allow them to make money in either direction. All they have to do is to
decide whether to move the market up of down. They do that by putting money
to work at specific times AND when price is at or near the upper or lower SD
(Standard Deviation) band. Ideally, they want to buy at or below the lower SD
and cash out at or above the upper SD and it works both ways of course.
They use this because they can apply basic statistical analysis to determine
which way to go, and when to put money to work.

2) On a given day, institutional computers are scanning multiple time frames, looking for
a) liquidity, and b) opportunity. For institutions, "opportunity" means that the distance
from where price is currently, to where they want to go, is sufficient to accept risk.
They also integrate the timing of economic reports, that are released periodically.
We create the same analysis in our trading room every weekend and every evening
we make our adjustments.

3) Each weekend, we analyze the previous price action, in light of where the probable
opportunity lies (long or short). We create scenarios based on where we think institutions
will buy or sell. As each day unfolds, we adjust to what we see, and filter price action through
the framing device (VWAP envelope).

As traders learn how to recognize these opportunities, they also learn how to intelligently
manage risk, to find the best trades and avoid giving it all back on poorly chosen trades.

We encourage struggling traders to take the time to consider and review the chart. As you can
plainly see, early in the sequence (starting with Asia/Japan/China) institutions are moving price
from the lower SD band, toward the upper band. These institutions are "telegraphing" that they
INTEND TO PUT MONEY TO WORK ON THE LONG SIDE. As you can see, that is what happened.
So, can you anticipate a trend day? The answer is, with the proper preparation, "YES"
 

Attachments

  • Importance of Recognititon.PNG
    Importance of Recognititon.PNG
    152 KB · Views: 11
Last edited:
Revised to Provide a Couple of Thoughts as follows

Trading Independence

As we move forward we encourage students to exit the trading room
and move to independent trading. This (in our opinion) is important because
in past we have seen traders use our advice as a crutch, rather than relying on
the training they received. What we have done is to institute a general rule
that everyone should exit after three (3) months. That in our opinion should be
a sufficient time in which to assess whether this approach works (for the trader)
and whether they are likely to obtain success.

Sentiment & Momentum

Thanks to my good friends in the profession, I am able to obtain relatively recent
information as to how sentiment affects performance (on every level from individual
stocks to indexes), and it turns out, (to no one's surprise) that good news begets
momentum to the upside, and vice versa. What is new it the persistence of that
momentum over time frames out to about 6 months, depending on the subset
the type (context) and timing. We have been doing historical review of various
economic reports, and looking at how social media is used to convey both positive
and negative sentiment. As with all our training we incorporate analysis of how
the previous report(s) affected price action. What we see is that knowing the relative
importance of news events, provides a significant edge.
 
Last edited:
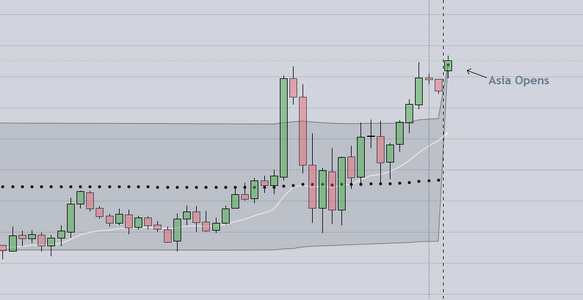
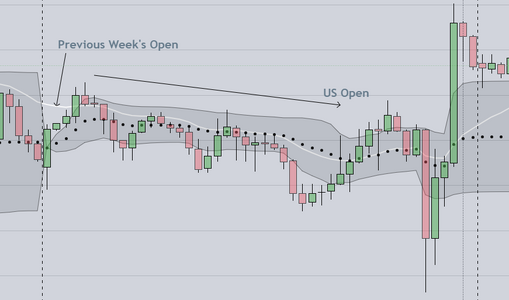
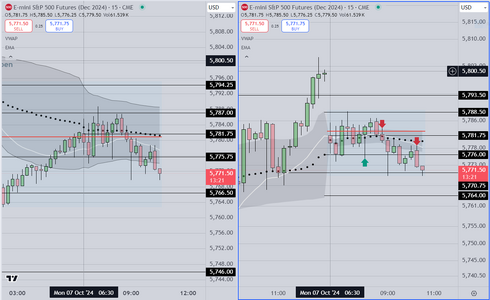
I started this post on Sunday 10-6 at 3pm PST
West Coast USA. The chart seen below shows
the Asia open and the previous week's open as
well for comparison

Our class starts in about 20 minutes at 3:30pm
We will be reviewing price action, planning the week
ahead, and integrating upcoming economic news into
the creation of scenarios (Long, Sideways, Short). We
grade each scenario in terms of confidence (we provide
a percentage confidence for each option), as well as
"Price Targets" (points at which we assume institutions
will react by putting money to work, buying or selling
the market). This is our preliminary meeting each week.

We also grade past performance (the assumption is that
you cannot improve unless you measure performance)
To that end we review the previous (session) identifying
setups that worked and those that failed.

Good Luck Everyone
 

Attachments

  • Asia Opens 10-6.PNG
    Asia Opens 10-6.PNG
    29.3 KB · Views: 7
  • Previous Monday Open.PNG
    Previous Monday Open.PNG
    44.5 KB · Views: 8
Last edited:
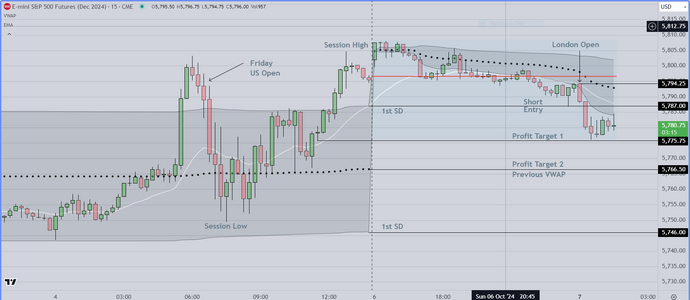
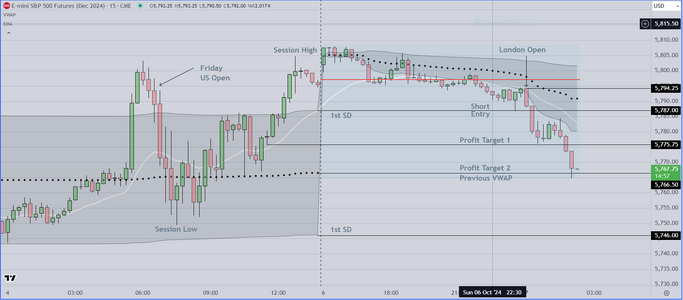
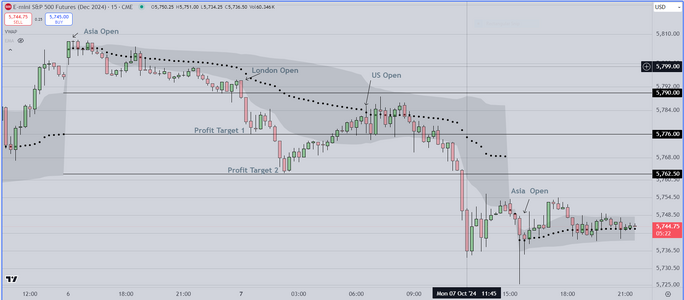
Anticipating a down move at the open I stayed up
to trade the London Open at Midnight (Local Time)

Although the setup is "textbook" breakout to the downside
it is more about experience than technique. At the Asia open
they (Japan/China) took interest in selling it down early. When
this happens, you can bet that there will likely be follow through
and so there was. The skew was to the downside from the open
so the only question was "where to get short. Our markup shows
the initial short entry and the 1st profit target. The 2nd profit target
is at the previous VWAP median. We have already put our stops in place
and will get some sleep, rather then watch this play out.

Took an extra moment to clean up the chart and make it a bit more
understandable

Good luck Everyone
 

Attachments

  • London Open F.PNG
    London Open F.PNG
    105.8 KB · Views: 11
Last edited:
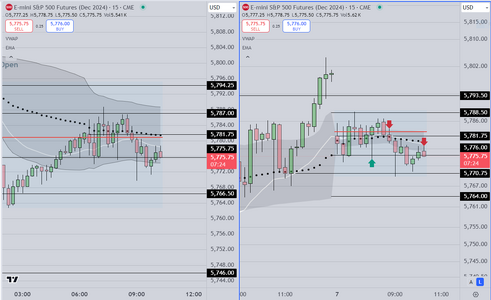
Readers following the previous posts will know that
we stayed up to trade the London Open (Midnight
local time) because our data suggested a strong move
down during the Globex session

At the US session open we anticipated a "TR" (trading range)
condition and that is what occurred. We suggest that amateurs
do not trade these conditions, however we did trade as shown
in the chart attached below. In this instance we used both pre-
programmed limit orders and stop orders. We have one (1)
pending trade in place that is currently profitable but will need
to be actively managed and my require scaling in if it moves against
us in the next hour.

The chart shows both the Globex and RTH display. We prefer to have
them side by side to obtain the context provided by the London
market.
 

Attachments

  • Monday 10-7 early trades.PNG
    Monday 10-7 early trades.PNG
    88.4 KB · Views: 7
Because this trade is likely to reverse (in our opinion)
we will close out at +5
 

Attachments

  • Early exit on current trade.PNG
    Early exit on current trade.PNG
    92.7 KB · Views: 7
We will post this chart showing what professionals call a "Round Trip", which starts
at the Asia Open, progresses through to London, and to the US session. It ends where
it began the next day. The important principles to cover are as follows;

1) Use of the VWAP envelope as a framing device. In this instance it is the previous day's
envelope that is used. Lines are extended from that envelope, and one can see price test
the 1st SD (Standard Deviation), the VWAP, and finally the lower SD, as Asia and Euro based
institutions took profit. This is called the "mark down" phase and it is the reason (if you read
the previous posts) that we stayed up to trade this session

The chart also shows the transition to London and finally to the US sessions, and this is
what institutions call the "markup", as participants recharge and get ready to sell inventory
bought as a discount to fair value.

There is a lot to unpack in this chart however we will wait to see if there is any interest. Ironically
this is the type of process (once understood) could provide a significant opportunity for trader
who may be struggling, IF they took the time to learn about it.

Good luck
 

Attachments

  • Asia to Asia Sequence.PNG
    Asia to Asia Sequence.PNG
    82.6 KB · Views: 8
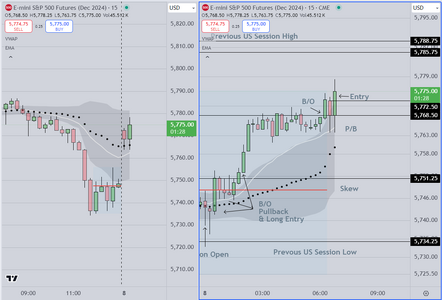
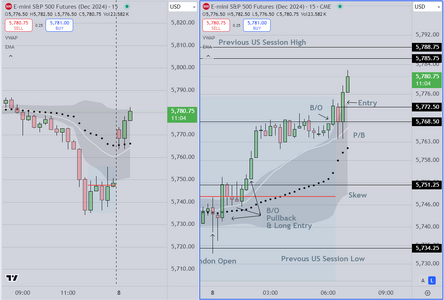
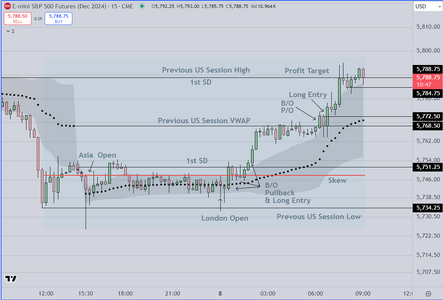
Starting Markup for Tues Oct 8 2024

This is my pre-open markup
Students trading the overnight (Globex) had an easy time of it

My first entry long after the B/O setup develops
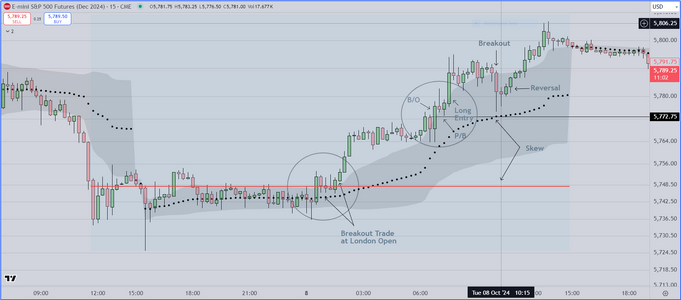
and the ETH display for those who prefer a simpler look
Most importantly, the skew (difference between the red line and black dots)
is positive, confirming the odds favor a move up towards the previous high
Best practice is to exit one unit at +5, and one unit at +10
and that is the morning trade
 

Attachments

  • 1st Trade Tues.PNG
    1st Trade Tues.PNG
    84.3 KB · Views: 6
  • ETH Display.PNG
    ETH Display.PNG
    85.5 KB · Views: 7
Last edited:
A final chart showing what we call a "continuation" seqeunce

This happens when during the London session, a breakout trade
sets up (and is successful). At that point the trader resets the red line
(VP/POC) and waits for the same setup to occur during the next
session. The timing is critical, that is to say it is common for the setup
to occur shortly after the open. This is because it is computer generated
and the same computers are creating the price action

For skilled traders, it is easy to take the trade (once the skew confirms
the odds are the same as the previous) and to hold (interested readers
can go back through the charts and see that it almost always results in
a +5 and +10 pt win

Also, refer to the red line (skew) and notice that it stays the same throughout
the session, however the black dots (VWAP) move up, indicating that buying
volume exceeds selling significantly (thus the skew indicates a tendency for
price to continue higher)

Good Luck
 

Attachments

  • Continuation Asia to US.PNG
    Continuation Asia to US.PNG
    73.8 KB · Views: 12
This is our EOD (End of Day) Markup

It shows the lead in to the London Session Open at the bottom
of the chart.

Review of previous posts will help create proper context

This week 8 traders will "graduate" from the class. They have all been
here for at least 3 months (our recommended limit). it is at this point
that we conference with them to 1) evaluate progress and 2) provide our opinion
as to their options going forward, and 3) we provide recommendations as to
additional resources they may want to consider.

At some point we will arrange for an "Open House" event, where interested
parties can attend and see how the class is run. More to come on that

Final Note

It is not uncommon for students to ask if they can stay on in this classroom
What all of them have in common is that they were net losers when they started
and at the conclusion of this period, they are all profitable but usually have concerns
that they can maintain the discipline necessary to stay profitable. We suggest they try
and we point out that the intent was never to be a signal service. That is not a sustainable
business model (for either side). We want them to have access to the tools we use, and
to the basic education necessary to build on the successes they have realized. Finally we
encourage them to maintain connections with classmates and other like minded traders,
and to communicate regularly with them so that they can create a supportive network
that IS sustainable.

Good luck

Important Postscript

I simplified and replaced the chart. As can be seen, there were two (2) breakouts, one at the start
of the London Session, the other at the start of the US session, THEN the market attempts to
reverse on a Wide Range Bar (WRB) down. Readers should look down and see that the SKEW
continues to indicate an up bias. This is why, when the reversal fails, skilled traders are able to
get on board for the final long entry, holding for a significant profit
 

Attachments

  • EOD.PNG
    EOD.PNG
    102.5 KB · Views: 9
Last edited:
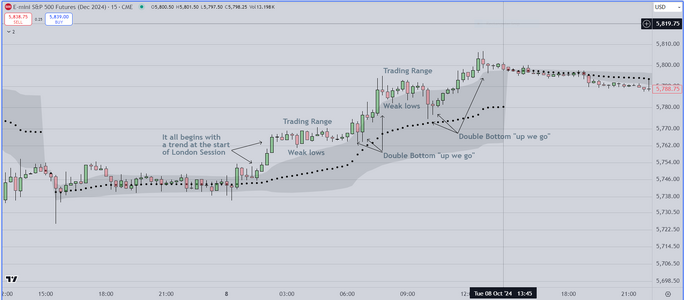
This chart shows how using a longer time frame (weekly) can
provide an edge. The way we teach this is to recognize the
difference between strong & weak highs & lows.

Strong high/Low

Strong highs & Lows are often a single candle with a tail (top
or bottom, or a double top or bottom. Entry on a 1-2-3, or a
breakout pullback entry pattern typically has higher odds of
succeeding (at least one additional candle in the same direction)
Once traders see a strong high or low, they look to get on board.
Its all about context. When traders see what looks like a trend, they
start to look for entry at creation of strong highs or lows, knowing
that these entries have about a 70% chance of succeeding

Weak highs/Lows are composed of multiple layers, (higher/lower) and
price seems to stay in the same area, creating a "trading range". typically
price will trade back & forth within the range for unknown period of time
Traders taking breakouts (on Stop Orders) generally lose money. Skilled
professionals mark the "bookends" and trade inside the range with Limit
orders, knowing that if price extends outside the range, it is not going very
far. This the why "scaling in" works"

I learned a mnemonic device for this as follows

"Trading range, weak low, double bottom, up we go
 

Attachments

  • Weak Highs & Lows.PNG
    Weak Highs & Lows.PNG
    85 KB · Views: 7
Last edited:
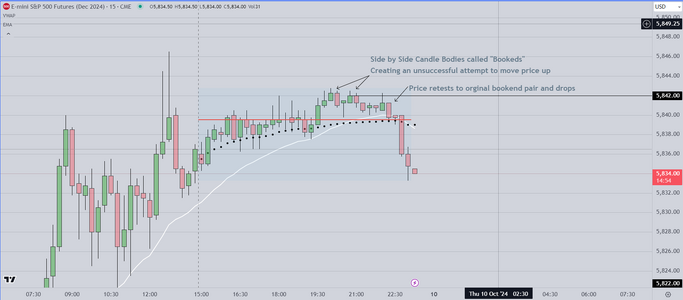
BOOKENDS TECHNIQUE

The "Bookends" technique is widely use by professionals. Simply put
you mark highest and lowest closes (side by side candles) and in that
process you create a trading range. Then you wait for price to break out
of the range, or to try to breakout and fail. Its an easy way to scalp trade
and make money during times when price is relatively quiet. I won't have time
to go into detail, but it is important to at least mention it. My new class starts
on the 15th, and at that point I simply won't have enough time to continue.

The chart still contains the VWAP (black dots) but it does not have the envelope
that goes with it. This (I hope) makes it easier to see the price action I was
trying to outline

Good Luck
 

Attachments

  • Bookends Technique.PNG
    Bookends Technique.PNG
    72.2 KB · Views: 10
Last edited:
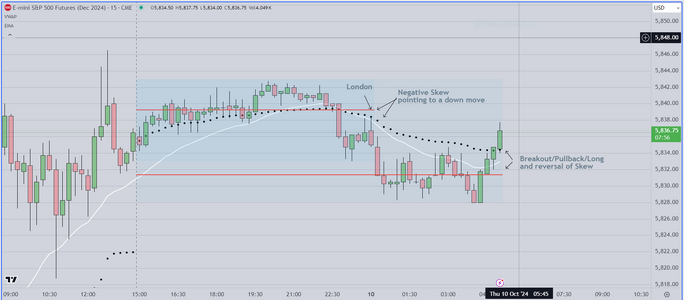
Skew as Confirmation of Trade Direction

The Skew is the difference between the Volume Profile POC and the VWAP

We covered this in previous posts. It is a powerful confirmation tool

The example shown is simple. At the London Open price action suggests
a short entry AND the skew is above the VWAP (black dots), suggesting that there is a statistical
preference for price to move down, and so it did

Later on, as seen in the lower part of the chart, the skew reversed and was below
the VWAP, suggesting a statistical tendency for price to reverse back up
it seems that this concept might be too difficult for people to follow so

I am going to stop posting at this point.

Good luck
 

Attachments

  • Skew to Confirm Trades.PNG
    Skew to Confirm Trades.PNG
    80.1 KB · Views: 9
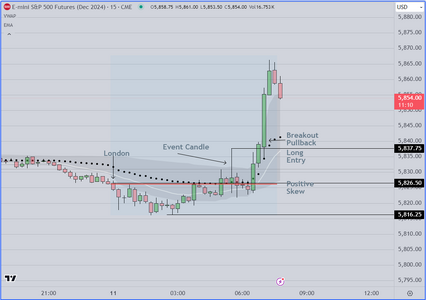
Hello

With permission from my students, I post these last two charts
The first is today's price action up to this moment

The second is the previous Friday

Very kind of them to allow me to do this
and as always, it is gratifying that that system
continues to work well

Good luck
 

Attachments

  • Friday Morning Price Action.PNG
    Friday Morning Price Action.PNG
    54.2 KB · Views: 6
  • Previous Friday.PNG
    Previous Friday.PNG
    49.3 KB · Views: 10
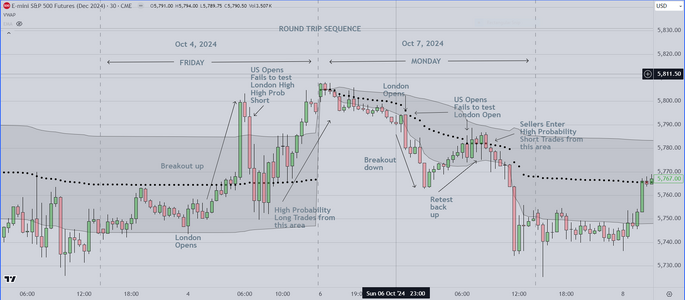
Hello Readers

My students have agreed that I can post the "end of week" markup
from the prior week (but not this week), so here it is (session dates
at the top of the chart).

Professionals call this a "Round Trip" and it shows the cyclical nature
of the market, as institutions drive price up, then back down to test previous
highs and lows.

The cycle consists of a breakout (up or down), followed
by a retest back to the origin of the breakout. This creates two (2) legs
and the retest leg is tradable if aligned with the "Skew" (as defined previously)
Skilled professionals learn to wait for the breakout, then evaluate the follow
through bar(s) before committing to a trade. Because the markets are fractal
this setup works on all time frames. Some of my students trade Forex and are
surprised to see just how long the breakouts last once they are confirmed. On
longer time frame charts, it is not uncommon to see these setups continue
for days, weeks and even months.

As mentioned previously I will soon offer a small group of readers a chance to see how this is
done live.

Good luck
 

Attachments

  • Round Trip Sequence.PNG
    Round Trip Sequence.PNG
    135.3 KB · Views: 10
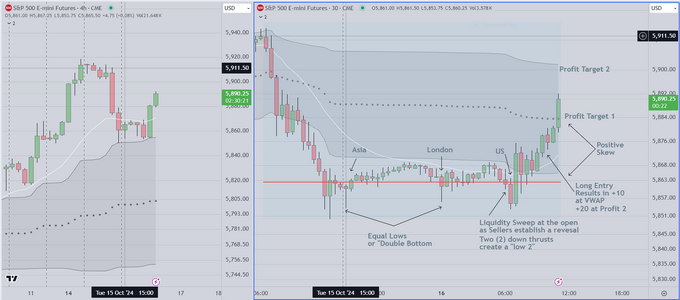
Again, generosity extended by my students

To be clear, by design my class is small and I have one (1)
professional, an old friend who is retired but continues to
trade. We have covered the subject of "liquidity" before but
as I have come to see, the retail students do not (yet) really
understand the concept

In this chart we show how institutions use liquidity as way to
1) establish a basis (a price or range of prices at which to buy
or sell) and how they 2) activate their positions (at specific times)

The display shows two charts, a four (4) hour and a thirty (30) min

The four (4) hour shows the range and direction, while the thirty (30)
min shows the setup and execution. Traders could also use 15 min
this is left to their discretion.

As seen on the right, Asia opens and does nothing. London is also
quiet until economic reports create movement. The content of the reports
is already known to the larger institutions and so they create the "equal lows"
or "double bottom" shown on that chart. The general rule is "do not buy above
a double bottom, do not sell below a double top. This is counter intuitive of course
and there is much skepticism amongst the students (but not our professional guest)
until the start of the US session, where those who wanted to buy earlier, saw the market
execute what we call a "liquidity Sweep" at the open. We cautioned that they be patient
and watch, while the setup (called a "low 2") developed. The charts shown were marked
up about an hour prior to the open. The entries (there were several options, were not known
but the profit targets were known, and they are always the VWAP median (the center line)
and the upper band of the VWAP envelope (also known as the 2nd Standard Deviation)
which by now has probably been hit.


Good luck
 

Attachments

  • Wed 16 Oct Sweep Example.PNG
    Wed 16 Oct Sweep Example.PNG
    129.6 KB · Views: 8
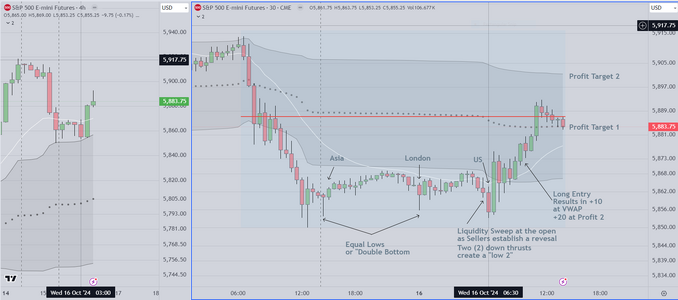
And this followup chart showing the result of the
short entry

Also note the change of skew (Red Line) which closes
as symmetrical (no preference long or short)
 

Attachments

  • END of SESSION.PNG
    END of SESSION.PNG
    122.7 KB · Views: 8
Top