bbmac
Veteren member
- Messages
- 3,584
- Likes
- 789
Gbpusd: W/e review
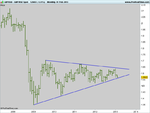
So the 5673-5878 move looks most likely to have been a pullback in the daily downtrend given Friday's price action ?
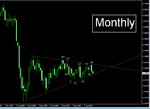
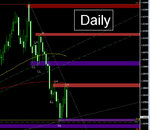
January ended on Thursday this week with a trading range of 675pips against a 20 month atr of 541, this was 125% of that 20 month atr. The Monthly candle closed as master bearish engulfing - it's body bearishly engulfing the previous 4 x monthly candle bodies. No fractal swing created by this monthly close but it came at a HH. Price remains under the 200sma on this t/f which remains under the 100sma...and the multi-month 5 year wedge is still intact although a downside break looks more probable now. the t/f remains in an opa range but it may become significant if this downside break of the multi-year wedge pattern should occur ?
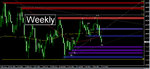
The Week ended with price covering 115 % (204pips) of thew 20 week atr (177pips.) The Weekly candle that was till Friday's 5878 hi looking so bullish (a candle is not a candle until it is closed !) actually closed as a bearish candle. No fractal swing created by the weekly candle close but it came at a LL. This t/f remains rangy-bearish re opa conditions (overall price action-previous fractal swing hi/lo analysis) now although no opa downtrend created yet. Like the Monthly - Price trades below it's 200 sma which is below it's 100sma.
Friday's Daily candle saw a pip range of 190pips which is 193% of it's 20 day atr (98pips.) The Friday daily candle closed bearishly after the pullback from 5673 weekly low the 4th LL of it's opa downtrend. No fractal swing created by the daily candle but it came at a LH and is likely to become a fractal swing in it's general opa downtrend- the candle was a master bearish engulfing x 3 thrust and closed close to it's low. Like the Mthly and Wkly the 200sma remains below the 100sma on this t/f and price trades below the 200sma.
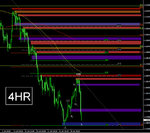
The 4Hr to 5878 was beginning to show signs of strength with 2 X HL and a HH at that 5878, but it is likley that the general opa downtrend on this t/f will be re-established following the strong move down off this HH which started pre-U.s NFP data but was compounded by market reaction to that. Price trades under it's 100sma which is under it's 200 sma on this t/f. NO fractal swing created by close of last 4hr candle which was bearish but it comes at a L on this t/f
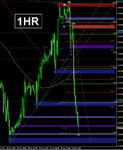
The 1Hr saw a fractal L printed prior to the U.s NFP data that was below the last 2 x HL's of it's previous general opa uptrend....the very sharp (off the edge of a cliff) fall from the subsequent LH at 5845 has now seen a LL printed at Friday's 5687 lo but this is not a fractal swing yet. Like the 4hr price trades below it's 100sma which is below it's 200sma on this t/f. the t/f has established a classic opa downtrend now.
G/L
So the 5673-5878 move looks most likely to have been a pullback in the daily downtrend given Friday's price action ?
January ended on Thursday this week with a trading range of 675pips against a 20 month atr of 541, this was 125% of that 20 month atr. The Monthly candle closed as master bearish engulfing - it's body bearishly engulfing the previous 4 x monthly candle bodies. No fractal swing created by this monthly close but it came at a HH. Price remains under the 200sma on this t/f which remains under the 100sma...and the multi-month 5 year wedge is still intact although a downside break looks more probable now. the t/f remains in an opa range but it may become significant if this downside break of the multi-year wedge pattern should occur ?
The Week ended with price covering 115 % (204pips) of thew 20 week atr (177pips.) The Weekly candle that was till Friday's 5878 hi looking so bullish (a candle is not a candle until it is closed !) actually closed as a bearish candle. No fractal swing created by the weekly candle close but it came at a LL. This t/f remains rangy-bearish re opa conditions (overall price action-previous fractal swing hi/lo analysis) now although no opa downtrend created yet. Like the Monthly - Price trades below it's 200 sma which is below it's 100sma.
Friday's Daily candle saw a pip range of 190pips which is 193% of it's 20 day atr (98pips.) The Friday daily candle closed bearishly after the pullback from 5673 weekly low the 4th LL of it's opa downtrend. No fractal swing created by the daily candle but it came at a LH and is likely to become a fractal swing in it's general opa downtrend- the candle was a master bearish engulfing x 3 thrust and closed close to it's low. Like the Mthly and Wkly the 200sma remains below the 100sma on this t/f and price trades below the 200sma.
The 4Hr to 5878 was beginning to show signs of strength with 2 X HL and a HH at that 5878, but it is likley that the general opa downtrend on this t/f will be re-established following the strong move down off this HH which started pre-U.s NFP data but was compounded by market reaction to that. Price trades under it's 100sma which is under it's 200 sma on this t/f. NO fractal swing created by close of last 4hr candle which was bearish but it comes at a L on this t/f
The 1Hr saw a fractal L printed prior to the U.s NFP data that was below the last 2 x HL's of it's previous general opa uptrend....the very sharp (off the edge of a cliff) fall from the subsequent LH at 5845 has now seen a LL printed at Friday's 5687 lo but this is not a fractal swing yet. Like the 4hr price trades below it's 100sma which is below it's 200sma on this t/f. the t/f has established a classic opa downtrend now.
G/L
Attachments
Last edited: