Anyone scalping the FTSE Futures??

Morning SD

Dow kicked off at the start yesterday, but fell away.
Do you know any reason for that?
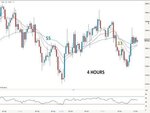
I can guess, SP500/FTSE were both 100% bearish, which means only fake news/triggering stops on shorts can make market go up, think Dow rose in response to europe and then once stops had been triggered there was no buying to sustain it.

its hard to find decent market report online.

this is guy is better than most

Markets Close Mixed, Flat And Uninspiring
 
ftse seems to be leading the pack with a green light ....the rest are a bit mixed ...dax green/amber
the us still tinkering....hk looked green/amber but has gone green....

lexic's lights:)

nasdaq still red
 
Last edited:
morning Dick Lexic and htw

FTSE 5810 acting as support overnight.

watch 5775 (lows in e-mini 1421.25) bounce from there would roughly be a double bottom on e-mini

5761 is 61.8% e-mini fib over two months
 
Last edited:
ftse seems to be leading the pack with a green light ....the rest are a bit mixed ...dax green/amber
the us still tinkering....hk looked green/amber but has gone green....

lexic's lights:)

nasdaq still red

Sounds like a band.... Lexic's lights and the new album Nasdaq Red
 
The technical condition of the stock market does not support the excessive optimism of the bullish majority of stock investors and traders. Fed and ECB plans to buy bonds in unlimited quantities (with fiat currencies printed out of thin air and backed by nothing but a theory and a hope) do not guarantee that stock prices will continue to rise, especially now that the news is out. Typically, action is followed by reaction, and so a downside correction seems overdue. Choosing safety over risk still appears to be the most reasonable approach for conservative traders and investors.

....Corporate insiders are extremely bearish. Insiders sold 5.97 shares for each share bought in September--up from 1.6-to-1 in May 2012...

TraderPlanet Today

what time does JPM report?
 
From D Pickard

One of the best ways of losing money in the markets is to jump in at the very first sign of the move you have been waiting for. In choppy, sideways conditions such as we have seen over recent weeks, doing so is a sure-fire recipe for getting stopped out rapidly thereafter. As a result, I did not go long yesterday, even though I am expecting a big Q4 rally in equities and despite the FTSE giving a swing-chart buy-signal. I remain cautious today, and am still prepared to short any further weakness.

Speaking of the FTSE, my pal Zak Mir (ZaksTA) sent me a very interesting chart. “It cannot be emphasized just how bullish a quadruple-tested RSI support line is.” The UK large-cap index’s daily RSI has bounced four times from below 50, which he reckons is a very positive omen. Zak called the early-year rally in the FTSE very nicely indeed, so I’ll be keeping a close eye on how his latest signal plays out.

The FTSE triggered a repeat buy-signal on its swing-chart yesterday. I had pointed out yesterday morning how the near-oversoldness on the fourhourly chart could well lead to a bounce. However, the move was not quite as decisive as I wanted to see in order to get long. A dip towards 5700 is a risk before the late-year rally to 6000 begins.

I might try a small short on a sharp drop through the 13-fourhourly EMA (5807.2).
 

Attachments

  • FTSE_121012--452x339.JPG
    FTSE_121012--452x339.JPG
    18.6 KB · Views: 79
So Pickard believes 6000 is on the cards towards the year end and Ftse trader believes a drop to 5500 is imminent.....
 
i wonder if the run up to the direct line float caused a "liquidity vacuum" similiar to the run up to FB float?
 
Dom on the s&p

Despite the messiness of the intraday action, volatility in the markets is actually on the wane - at least by one measure. The daily Bollinger bands on both the S&P and the FTSE are moving closer together. Bollinger bands are wavy lines plotted mathematically either side of a moving average, in this case the 20-day average. In quieter markets, the distance between these lines narrows.
This phenomenon of narrowing Bollinger bands is known as 'the squeeze'. It matters because it is usually followed by a sharp move in the price. I think of it as the calm before the storm. And, as a rule of thumb, the subsequent move tends to be in the direction of the prior trend, which in this case would be upwards. The last example of this in the S&P was in early September, after which the index spurted to its bull-market highs to date.

Such a move would tie in nicely with the message of the various timing and seasonal factors that I follow. We are entering the seasonal sweet spot for equities on both sides of the Atlantic. The tendency is especially positive between now and 9 November. At the same time, the US Presidential Election - held on 6 November - should also provide a boost to American shares, if history is anything to go by.
 

Attachments

  • 2_a_Squeeze_091012--450x270.JPG
    2_a_Squeeze_091012--450x270.JPG
    16.3 KB · Views: 110
Top