You are using an out of date browser. It may not display this or other websites correctly.
You should upgrade or use an alternative browser.
You should upgrade or use an alternative browser.
It's still going, hope some of you guys are still in that... nice move on a Monday 🙂
Damn it!
I knew I shoulda gone shopping 😀 😀 😀
😀
SuddenDeath
Legendary member
- Messages
- 14,063
- Likes
- 143
u got the 5610 low to the point
u got the 5610 low to the point
Not me, it was Soaquan. He's taking the micky out of me 🙂 But, seriously, he could have gone shopping!
barjon
Legendary member
- Messages
- 10,752
- Likes
- 1,863
Still thinking about this dow ratio...... ftse now 5649 x 2.25 = 12710 currently quoted at sell 12750 buy 12755 so the ftse is weak?
HW
I just use a straight 2:1 - it doesn't matter if you're precise since you are looking for a change in the ratio.
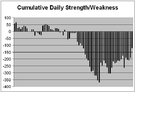
The thumbnail chart is the cumulative position of FTSE compared to DOW this year building up day by day. You'll see that FTSE started off a bit above where it would have been had it followed the DOW (ie: traded strongish) but then became weaker and weaker until, at one stage it was some 350 below where it would have been had it matched DOW (ie: it traded very weak overall). Since then it has got back to only 120 below where it should have been so has traded strong overall to get there.
This is a cumulative chart though (and it's not entirely pure because there's a lot of days bunched together in single bars when I've been away) and you'll see within it the day to day fluctuations weak and strong - it's those day to day (or hour to hour) fluctuations that you play with a pair trade.
Attachments
SuddenDeath
Legendary member
- Messages
- 14,063
- Likes
- 143
Not me, it was Soaquan. He's taking the micky out of me 🙂 But, seriously, he could have gone shopping!
where is the "global moderator" when u need him
Dick Lexic
Veteren member
- Messages
- 4,954
- Likes
- 124
interesting new thead started under futures......follow the smart money COT analysis
SuddenDeath
Legendary member
- Messages
- 14,063
- Likes
- 143
interesting new thead started under futures......follow the smart money COT analysis
thats great Dick Lexic,
Dick did u watch the trader meeting?
Dick Lexic
Veteren member
- Messages
- 4,954
- Likes
- 124
do you mean the power trading radio video?
Dick Lexic
Veteren member
- Messages
- 4,954
- Likes
- 124
sd thats a good find...think you should post this on a new thread so others on the boards can view ....lots of people suspect this sort of thing is going on but some keep saying it's not possible.
you could also stick it on here and creat a riot ha ha
http://www.trade2win.com/boards/spread-betting/16595-capital-spreads.html
Last edited:
SuddenDeath
Legendary member
- Messages
- 14,063
- Likes
- 143
sd thats a good find...think you should post this on a new thread so others on the boards can view ....lots of people suspect this sort of thing is going on but some keep saying it's not possible.
you could also stick it on here and creat a riot ha ha
http://www.trade2win.com/boards/spread-betting/16595-capital-spreads.html
at the beginning Merlin rothfeld (man on the left) calls spread betting a ponzi scheme. and dislikes the fact that they do not allow you to place buy and stops where u like. these guys are associated with the online trading academy.
the lesson is place stops where they cannot be spiked out. or go direct access, trade real futures.
SD, I am not going into another of those SB vs. DA arguments at my time of life because everyone should know what he wants to do with his money and the subject has been done to death over the years and all over this site but, as an example, this very morning, I was trading Euro/GBP and saw the price go down to less than a point away from my stop, when it turned and the trade went into profit,
If, as that guy on the video says, someone clears out all the stops, why wasn't I closed out this morning?
If, as that guy on the video says, someone clears out all the stops, why wasn't I closed out this morning?
SD, I am not going into another of those SB vs. DA arguments at my time of life because everyone should know what he wants to do with his money and the subject has been done to death over the years and all over this site but, as an example, this very morning, I was trading Euro/GBP and saw the price go down to less than a point away from my stop, when it turned and the trade went into profit,
If, as that guy on the video says, someone clears out all the stops, why wasn't I closed out this morning?
Done 2 years on DMA and the last 5 years on SB.
At the end of the day you can make and loose money on both.
Morning All
BHP -1.10%
RIO -1.20%
30 to go
China imports missed forecast and drop in new export orders(Eurozone is my guess)
Imports 6.3% in June Y/Y vs 12.7% in May Y/Y
Exports 11.3% in June Y/Y vs 15.3% in May Y/Y
Trade Balance $31.73B in June vs $18.70B in May
Aussie dollar and Dow Futures under pressure since the China release.
Not a great lead for the FTSE bulls, 5580 to 5610 strong support area.
SuddenDeath
Legendary member
- Messages
- 14,063
- Likes
- 143
morning bustech
so more weakness in ftse
so more weakness in ftse
hereward the wake
Senior member
- Messages
- 3,154
- Likes
- 124
Thank you for that ... very usefulHW
I just use a straight 2:1 - it doesn't matter if you're precise since you are looking for a change in the ratio.
The thumbnail chart is the cumulative position of FTSE compared to DOW this year building up day by day. You'll see that FTSE started off a bit above where it would have been had it followed the DOW (ie: traded strongish) but then became weaker and weaker until, at one stage it was some 350 below where it would have been had it matched DOW (ie: it traded very weak overall). Since then it has got back to only 120 below where it should have been so has traded strong overall to get there.
This is a cumulative chart though (and it's not entirely pure because there's a lot of days bunched together in single bars when I've been away) and you'll see within it the day to day fluctuations weak and strong - it's those day to day (or hour to hour) fluctuations that you play with a pair trade.
hereward the wake
Senior member
- Messages
- 3,154
- Likes
- 124
Morning chaps
SuddenDeath
Legendary member
- Messages
- 14,063
- Likes
- 143
looking at current dow/sp500 ftse should be about minus 4pts on open
SuddenDeath
Legendary member
- Messages
- 14,063
- Likes
- 143
Biderman's Daily Edge 7/9/2012: Next QE Not Until Stocks Drop Another 15% but Unlikely to Work
Biderman's Daily Edge 7/9/2012: Next QE Not Until Stocks Drop Another 15% but Unlikely to Work - YouTube
Biderman's Daily Edge 7/9/2012: Next QE Not Until Stocks Drop Another 15% but Unlikely to Work - YouTube
SuddenDeath
Legendary member
- Messages
- 14,063
- Likes
- 143
Pivots
Buy 5637
Sell 5627
Dow 9pm close = ftse level 5635
Buy 5637
Sell 5627
Dow 9pm close = ftse level 5635
Similar threads
- Replies
- 1
- Views
- 3K